Figure 1.
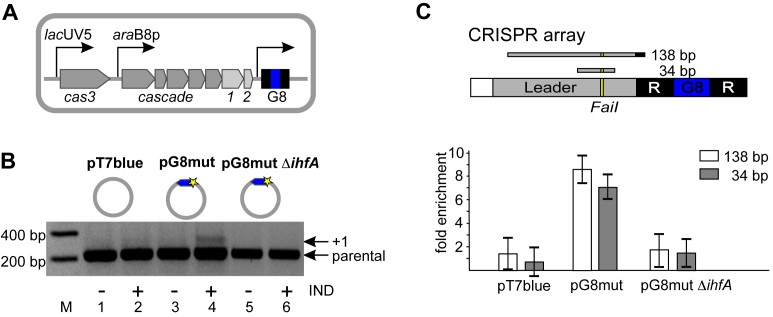
Cas1 is associated with CRISPR array leader in cells undergoing primed adaptation. (A) The KD263 Escherichia coli cells containing inducible cas genes and a single CRISPR array containing G8 spacer (blue) are schematically shown. (B) KD263 cells were transformed with pT7blue vector or pG8mut plasmid containing a G8 protospacer (blue) with a mismatch mutation (yellow star). The KD263 derivative strain carrying a deletion of the ihfA gene was transformed with pG8mut plasmid. Cells were grown with or without induction (‘+/−’, correspondingly) and PCR with oligonucleotide primers annealing upstream and downstream of CRISPR array was performed. ‘Parental’ marks a PCR amplification product corresponding to unexpanded, parental CRISPR array. The ‘+1’ band corresponds to CRISPR array expanded by one spacer-repeat unit. (C) The KD263 CRISPR array and upstream leader region is schematically shown at the top. 138 and 34 bp DNA products of amplification are shown. The FaiI recognition site is indicated. Below, results of Cas1 ChIP analysis with primer pairs amplifying each of the two leader fragments and cells shown in panel B are presented. Results from two additional biological replicates are shown in Supplementary Figure S2A. Here and in other figures showing qPCR data fold enrichment values correspond to ratios of relative concentrations of each fragment subjected to amplification in induced and uninduced cells containing indicated plasmids. Mean values and standard deviations in triple technical replicates are presented.

