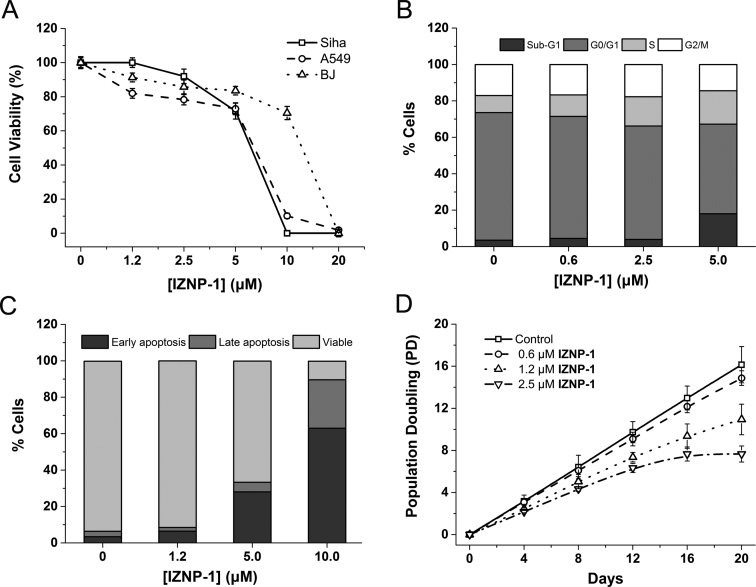
Figure 5.
(A) The cell growth inhibition curves of tumor cells (Siha and A549 cells) and normal cells (BJ fibroblasts) after a 24-h treatment with IZNP-1. The data were reported as the percentage of growing cells in respect to that of the untreated cells. (B) The cell cycle analysis of Siha cells after 12-h treatment with IZNP-1. The cells were collected and stained with propidium iodide (PI). (C) An apoptosis evaluation of Siha cells after a 12-h treatment with IZNP-1. The cells were collected and stained with Annexin V–FITC and PI. (D) The proliferation curves of Siha cells treated with IZNP-1. The cells were counted and passaged at the indicated times, and the population doubling (PD) values were calculated from the cell amounts.

