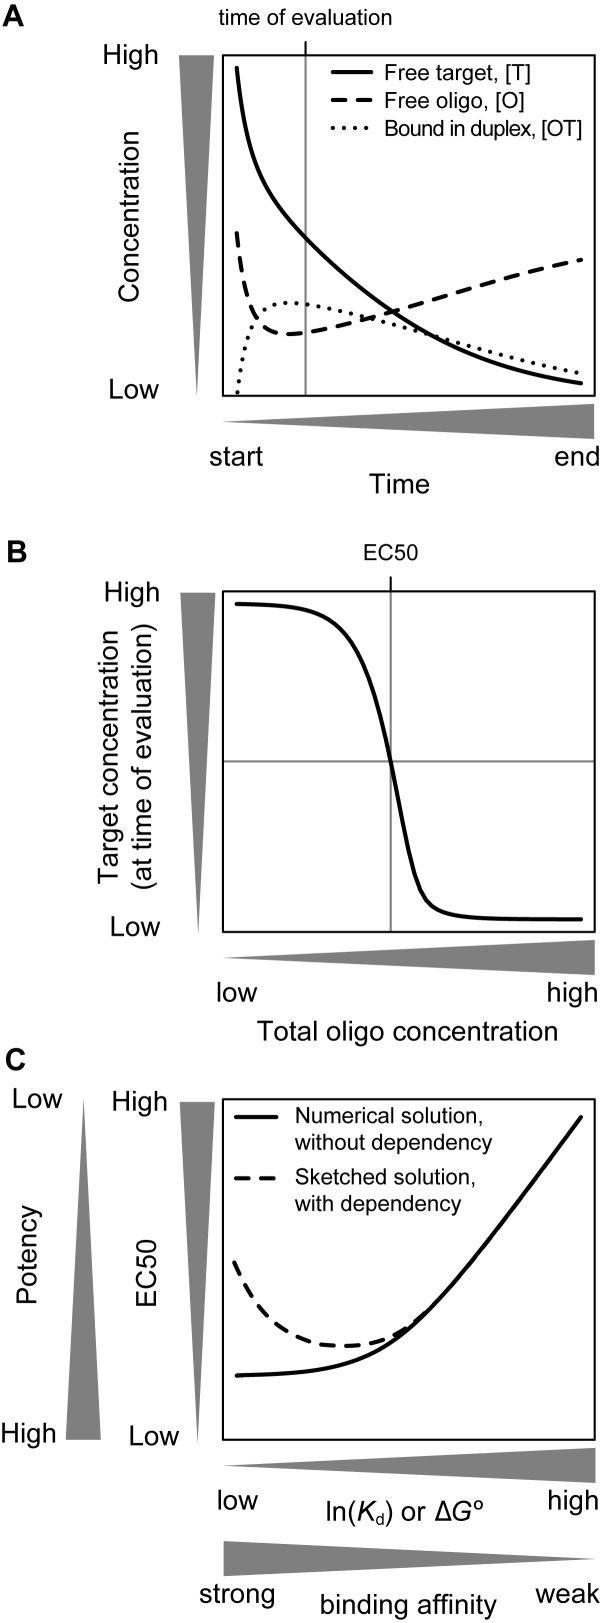
Figure 4.
Model solutions of reactions (1a) and (1b) leading up to the relationship between binding affinity and potency. (A) Time-resolved numerical solution of the relative concentrations of free target RNA, [T], free gapmer oligonucleotide, [O], and the duplex between gapmer and RNA, [OT]. At a fixed time point, denoted by the vertical grey line, the concentration of RNA target is recorded, and in (B) plotted as a function of the total concentration of gapmer. From this curve, the gapmer concentration at which a half-maximal effect is achieved can be identified, and in (C) plotted as a function of the dissociation constant, Kd, between free gapmer and target RNA, and duplex (solid line). The relationship between binding affinity and potency presented in Pedersen et al. (48), is sketched as a dashed line.

