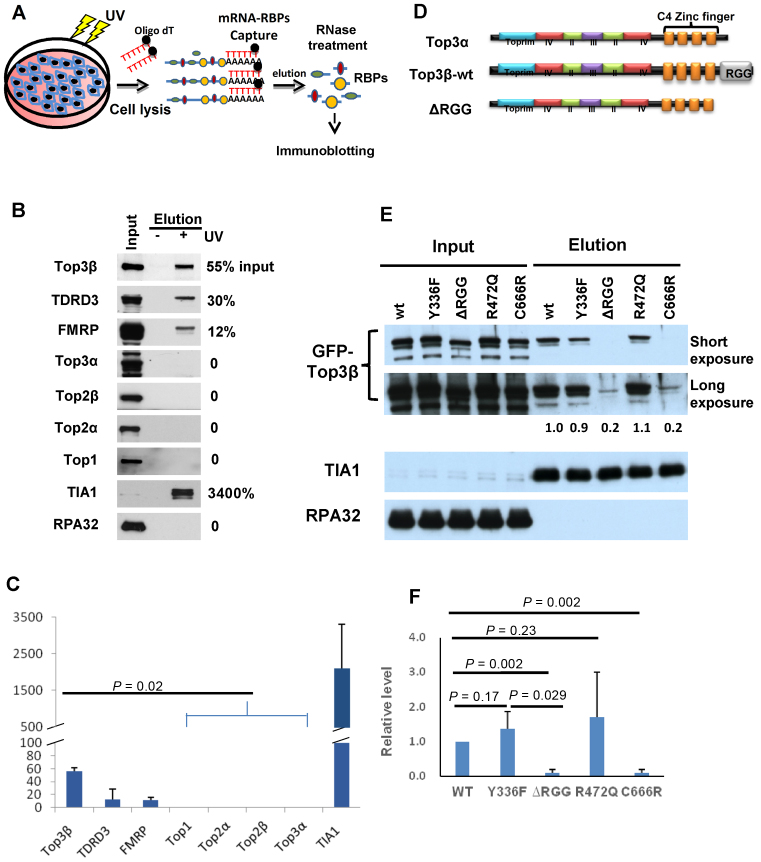
Figure 1.
Top3β is a major mRNA-binding topoisomerase and requires its RGG RNA-binding domain to bind mRNAs in vivo. (A) Schematic representation of an mRNA-binding protein capture assay modified from previous studies (21,22). mRNA and its RNA binding proteins (RBPs) were crosslinked by UV treatment in cells. After cell lysis, the mRNA-RBP complexes were captured by oligo-dT beads. After washing, the complexes were eluted and treated with RNase. The topoisomerases in RBPs were identified by immunoblotting. (B) Immunoblotting images and (C) quantification of mRNA-binding proteins captured on oligo-dT beads from lysates of HEK293 cells untreated or treated with UV. In (B), the relative ratios between the immunoblotting signals in the captured complex (lane 3) and the input (lane 1) were shown on the right. Only 0.1% of the input extract was loaded on the gel, whereas 50% of the eluted mRNA-bound RBPs were loaded. In (C), the graph shows the means of the relative ratios between the signals of the eluted proteins and the input from three independent experiments. The error bars indicate standard deviation. P-values between Top3β and other topoisomerases are calculated using Student's t-test. (D) Schematic representation of human Top3α, Top3β-wildtype and its RGG-deletion mutant (ΔRGG) proteins. The conserved core domains and the non-conserved CTDs, including Zn-fingers (orange boxes) and RGG-box, are indicated. Notably, the domain structure of Top3α and Top3β are highly similar, except the RGG-box which is only present in the former but not latter. (E) Immunoblotting images and (F) quantification from the mRNA-binding protein capture assay showing that GFP-tagged Top3β-ΔRGG and C666R mutants have strongly reduced mRNA binding activity after transfection in HEK293 cells, whereas Y336F and R472Q mutants retained the activity. In (B), for each Top3β mutant, the relative ratio of its immunoblotting signal in the captured mRNA complex versus the signal of the wild-type protein was shown between the images. A positive (TIA1) and negative (RPA) control was shown. In (F), the graph shows the means of the relative ratios between the immunoblotting signal of each mutant and that of the wild-type protein from three independent experiments. The error bars indicate standard deviation. P-values between Top3β and other topoisomerases are calculated using Student's t-test.

