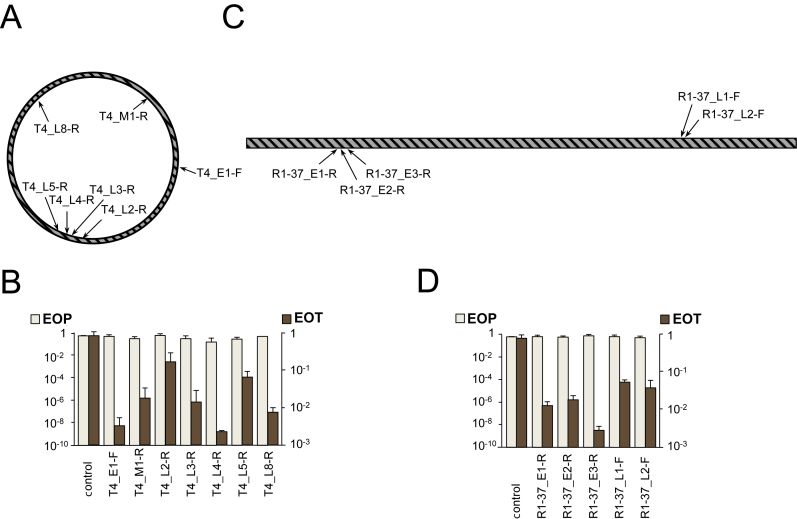
Figure 4.
The effect of CRISPR–Cas targeting on T4 and R1–37 infections. (A) The circular genome of bacteriophage T4 is shown. Genes belonging to different expression classes are scattered throughout the genome. Arrows indicate the positions of protospacers targeted by crRNA spacers of strains from our collection. (B) EOP by T4 and EOT by cognate protospacer-containing plasmids into indicated strains. Mean values and standard deviations from three independent experiments with each strain are shown. EOP values for strains targeting additional protospacers can be found in Supplementary Table S1. (C) The linear genome of bacteriophage R1–37 and positions of protospacers targeted by crRNA spacers of strains from our collection. Genes belonging to different expression classes are scattered throughout the genome. (D) EOP by R1–37 and EOT by cognate protospacer-containing plasmids into indicated strains. Mean values and standard deviations from three independent experiments with each strain are shown. EOP values for strains targeting additional protospacers can be found in Supplementary Table S1.

