Figure 1.
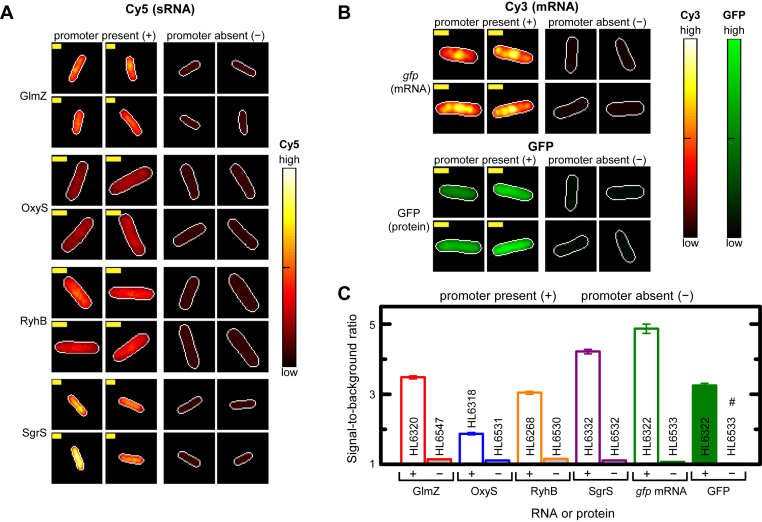
RNA FISH specifically detects sRNAs and mRNAs. (A and B) sRNA and mRNA signal intensities in representative cells with and without a promoter (PCon or PLlacO-1) in the Cy5 (A), Cy3 (B) or GFP (B) channels. Signal intensity in cells is shown as a heat map with ‘global normalization’ (main text). Cell edges (white line) were identified by phase contrast and transferred to Cy5, Cy3 or GFP channels. Yellow scale bar is 1 μm for all images. Strains with promoter: glmZ (HL6320; n = 375); oxyS (HL6318; n = 105); ryhB (HL6268; n = 233); sgrS (HL6332; n = 499); gfp (HL6322; n = 133). Strains with no promoter: glmZ (HL6547; n = 428); oxyS (HL6531; n = 281); ryhB (HL6530; n = 199); sgrS (HL6532; n = 579); gfp (HL6533; n = 278). All gfp measurements were in the presence of 1 mM IPTG. (C) Signal-to-background ratios with and without transcription for each RNA or protein. Error bars are the SEMs. # bar and error are ∼1 and 0 and therefore not visible. Statistical comparison of mean signal-to-background ratios between strains with and without a promoter was significant for all pairs (P-values for all pairs < 1 × 10−58; Mann–Whitney U two-tailed test and two-tailed t-test).

