Figure 3.
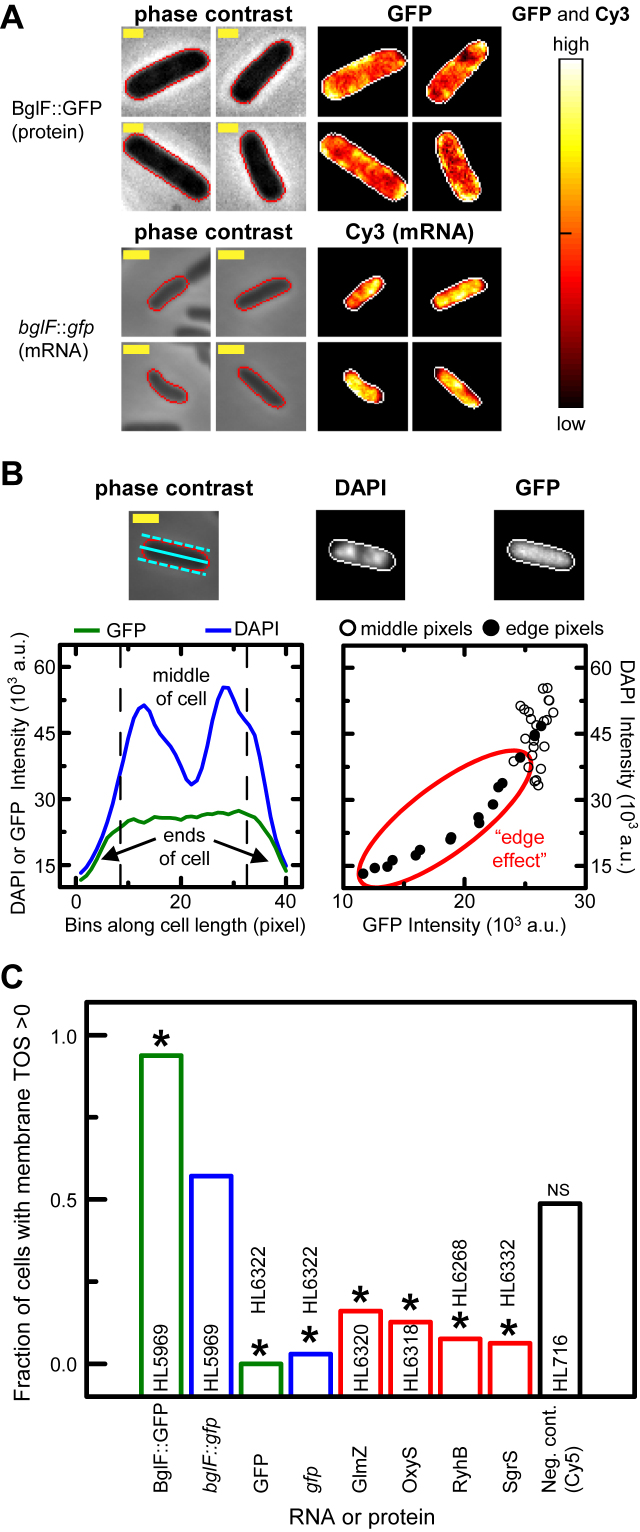
sRNAs display no preferential membrane localization. Cell edges were identified as in Figure 2A. Yellow scale bar indicates 1 μm. (A) mRNA and protein localization of bglF::gfp (HL5969) in representative cells shown for the phase contrast, GFP (n = 304) or Cy3 (n = 84) channels. Signal intensities of Cy3 and GFP are shown as heat maps with cellular normalization. Measurements were made at 1 mM IPTG. (B) ‘Edge effect’ shown in a cell with GFP expression (HL6322). Average GFP fluorescence and DAPI signals along the longitudinal axis (upper cell images); both signals decrease at the cell ends (left lower plot) resulting in a positive correlation for binned pixel values (right lower plot; circled with a red line). Solid and dash cyan lines in the phase contrast image show the center and edges of the longitudinal axis. (C) Fraction of cells with membrane localization (‘membrane TOS’ > 0) in strains probed for sRNAs and mRNAs, or expressing GFP. Analysis was performed on measurements collected for Figure 2 (HL6322, HL6320, HL6318, HL6268, HL6332, and HL716). The number of cells with TOS > 0 was compared between the positive control (bglF::gfp) and each of the sRNAs and mRNAs using Fisher's exact test. * indicates statistical significance (P < 1 × 10⁻⁶). NS indicates no significance (P = 1.8 × 10⁻¹) for the negative control (Cy5).

