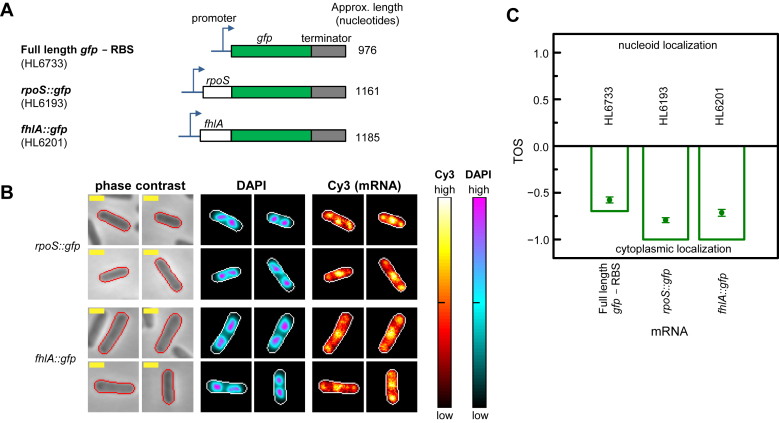
Figure 5.
Localization of target mRNAs fused to gfp. Cell edges were identified as in Figure 2A. Yellow scale bar indicates 1 μm for all images. Measurements were made at 1 mM IPTG. Note: HL6733 data are the same as that shown in Figure 4 and are reshown to enable convenient comparison. (A) Full length gfp mRNA with and without additional untranslated and coding sequences. (B) Localization of gfp mRNA in representative cells with each of the genes in panel A. DAPI and Cy3 signal intensities (cellular normalization) represented as heat maps. Sample sizes: HL6733 (n = 186), HL6193 (n = 177) and HL6201 (n = 98). (C) TOS for strains with each of the genes shown in panel A. Bars are the medians, circle symbols are the means and error bars are the SEMs. Differences in the TOS values for the following pairwise combinations of samples were statistically significant (Mann–Whitney U two-tailed test): full length gfp mRNA – RBS versus rpoS::gfp mRNA (P = 2.3 × 10⁻⁷) and full length gfp mRNA – RBS versus fhlA::gfp mRNA (P = 1.2 × 10⁻²).

