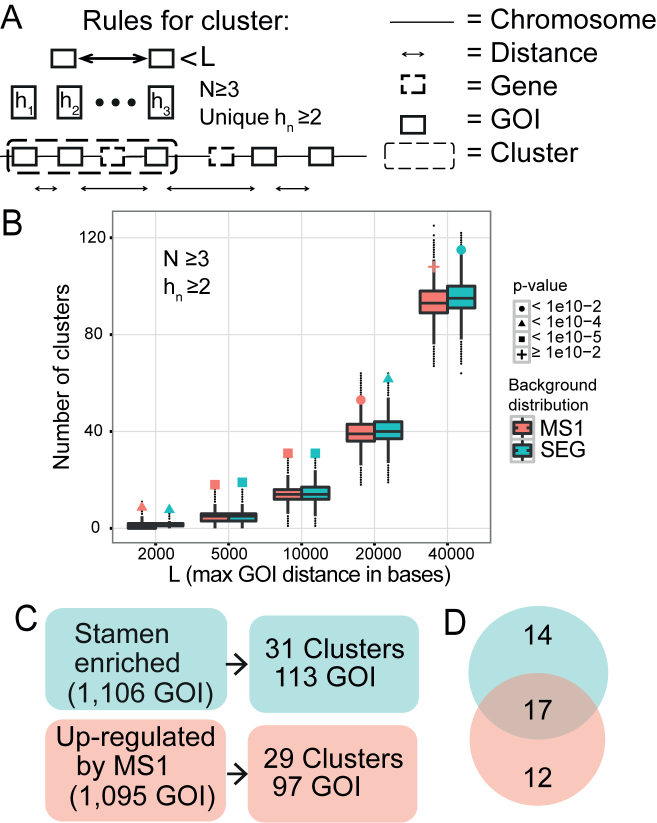
Figure 1.
Identification of co-expressed physical clusters in stamen development. (A) Schematic view of the physical clustering analysis tool developed to identify clusters of co-regulated genes. To be assigned as a cluster at least N GOIs (genes of interest) with a maximal distance L bases between adjacent GOIs has to be identified, and with at least hn groups of homologous genes. The distance L is measured between the gene ends closest to each other. (B) Number of clusters detected in the SEG (green) and MS1 (red) datasets, as a function of L. The background distributions, obtained from simulations, are shown as a boxplot. The actual number of clusters found is marked with a filled dot, triangle, square, or plus sign, depending on the P-value assigned by the corresponding background distribution. N was set to three and hn (number of homologous groups) was at least two. (C) The number of clusters found in the two datasets when N ≥ 3, hn ≥ 2, and L ≤ 10 000 bases. (D) Venn diagram showing the number of clusters that were unique and in common for the two datasets. The intersection is the 17 SEG-MS1 clusters studied in depth.

