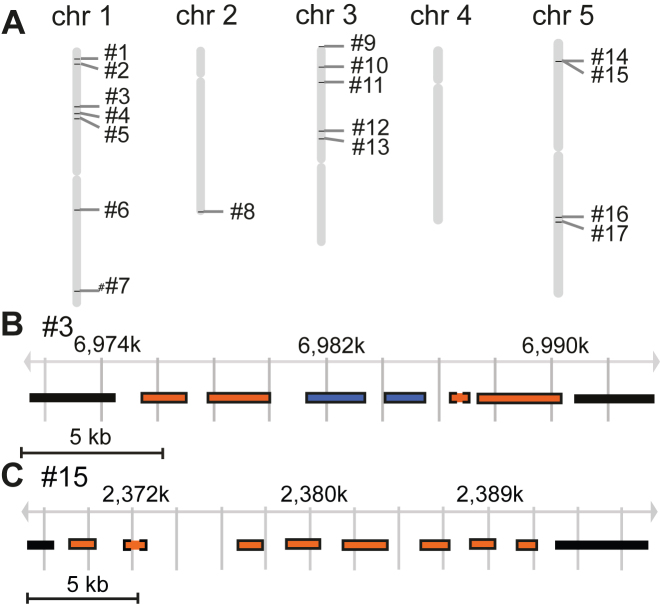
Figure 2.
Chromosomal position and gene composition of the clusters. (A) The position of the clusters on the A. thaliana chromosomes. (B) and (C) show a close-up of cluster #3 (loci At1g20120-150) and cluster #15 (loci At5g07490-560), respectively. (Supplemental Figure S3 shows close-ups of all 17 clusters). The chromosomal region of each cluster is indicated by position coordinates (in kilobases). Each gene in the clusters is shown as a rectangle. Blue color indicates that the gene has a homolog within the cluster, whereas orange indicates lack of homolog within the cluster. Surrounding solid line: GOI; Surrounding dashed line: non-GOI. Graphs are adopted from Gbrowse using TAIR10 as the data source.

