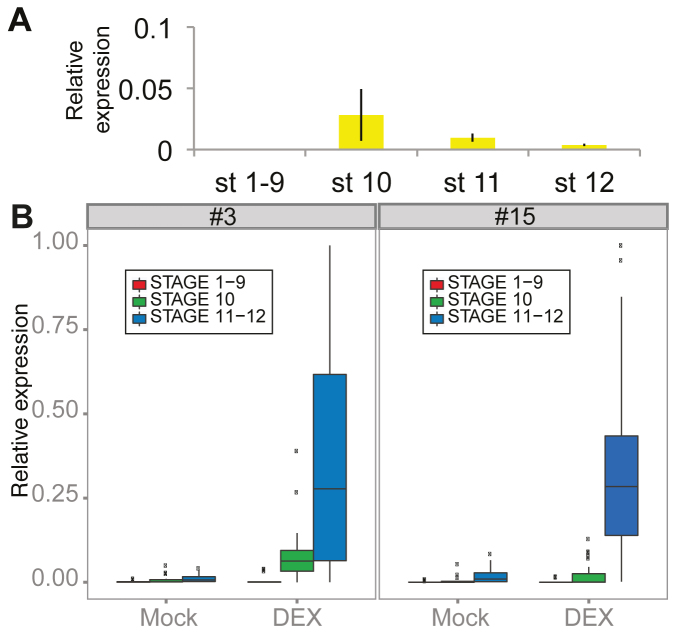
Figure 3.
Expression levels in floral buds of different developmental stages. (A) Relative expression levels of MS1 in floral buds of stages 1–9, 10, 11 and 12 assayed using qRT-PCR. (B) Box-plots showing the relative expression levels of all GOIs present in clusters #3 and #15. Expression levels were assayed 48 h after DEX or Mock treatment. Error bars in (A) denote standard error of three biological replicates. Expression of each gene was normalised against the value of two reference genes, ß-tub and UBQ5.

