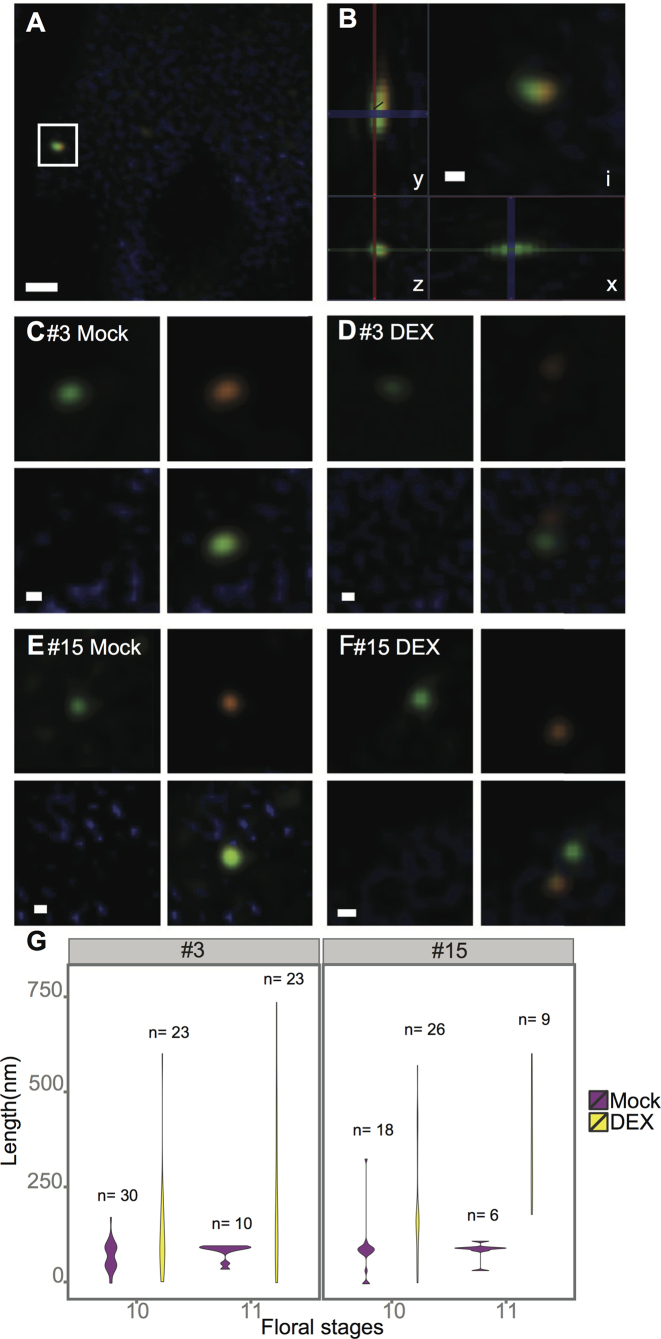
Figure 4.
Chromosomal de-condensation estimated by DNA FISH. Biotin- (orange) or DIG- (green) labelled probes targeted against the two flanking regions of either cluster #3 or #15 were used. (A) A tapetum cell with a pair of green and orange signals, marked by a square (cluster #15, DEX). (B) The inset (i) from micrograph (A) and distance measurement along the x-, y- and z-axis. (C–F) Micrographs showing examples of signals collected from: tapetum cells of MOCK- (C, E) and DEX- (D, F) treated samples, using the probes targeted against cluster #3 (C, D) or cluster #15 (E, F). (G) Violin plots showing the frequency distribution of the distance between Biotin- and DIG-labelled probes directed against the flanking regions of cluster #3 (left) and cluster #15 (right). Mock: negative control; DEX: dexamethasone treated samples. Size bars: 500 nm (B) and 100 nm (C to G).

