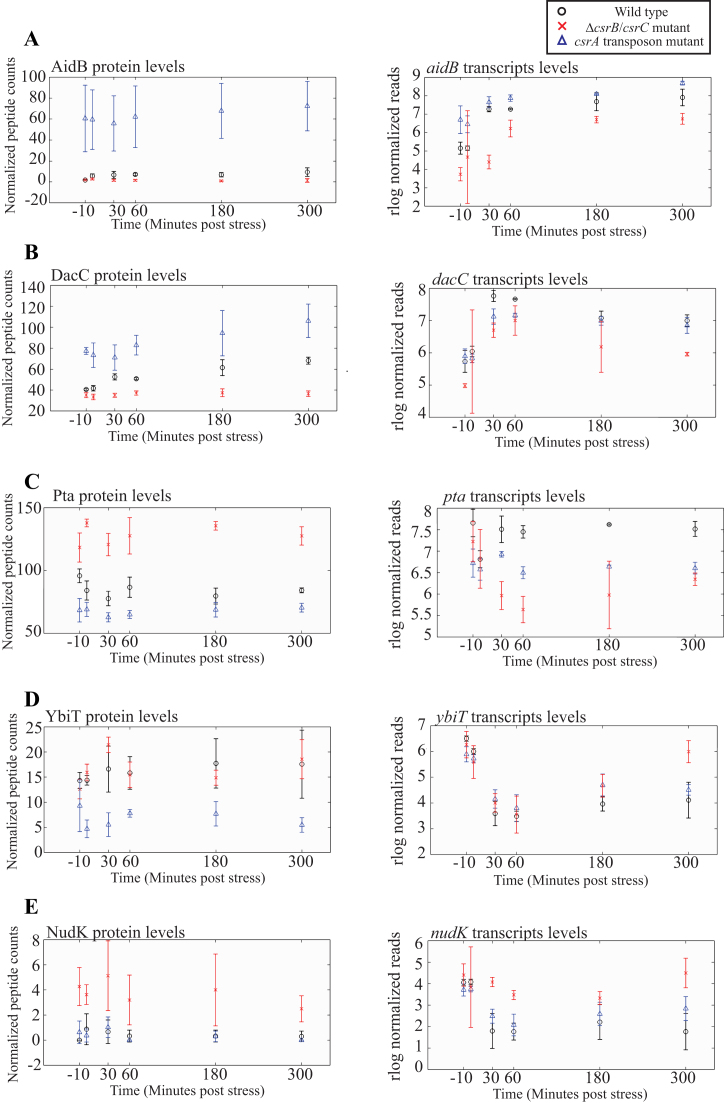
Figure 2.
Genetic responses to Csr components. (A–E) Genes representative of patterns in each class. For each class I–V, we show protein and transcript expression levels of a representative gene. Error bars depict standard deviation of three replicates. Specifically, class I and II class have lower expression of the gene's protein and transcript or just protein respectively in the wild type than the csrA::kan mutant. Class III and IV have the inverse patterns to class I and IV. Class V genes show no recognizable relationship to the csrA::kan mutant; expression effects are observed in the ΔcsrBΔcsrC mutant relative to the wild type.

