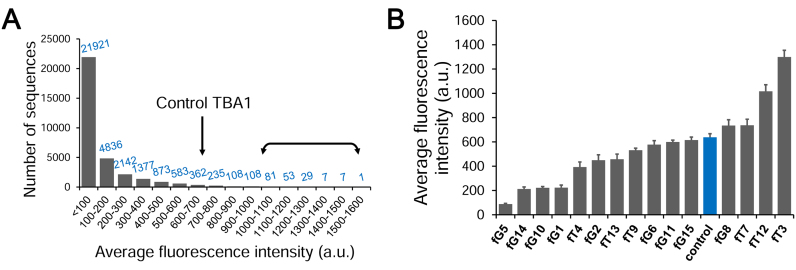
Figure 2.
Recorded fluorescence intensities at a thrombin concentration ([Thr]) of 200 nM. (A) Number of sequences found per subrange (100 a.u.) of fluorescence. Background fluorescence is 47. The arrow denotes the subrange where the control sequence is found (fluorescence intensity of ∼640). The double arrow marks the range where high-binding sequences were identified and used for the measurement of binding affinity (178 sequences). (B) Average fluorescence intensity for each single-modified TBA1 sequence. The unmodified control is coloured blue. The error bars represent the standard error of the mean of the fluorescence signal.

