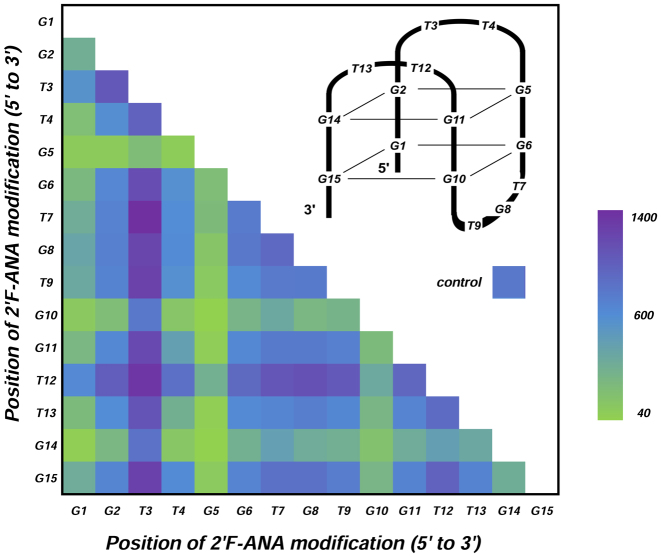
Figure 3.
Average fluorescence intensities for all possible sequences (105) containing two 2΄F-ANA modifications. The diagram plots the position of a first 2΄F-ANA unit against the position of the second 2΄F-ANA unit. The recorded intensities are arranged as a coloured heatmap, green corresponds to lowest signals and purple to the highest. Colour for the control TBA1 is given as reference.

