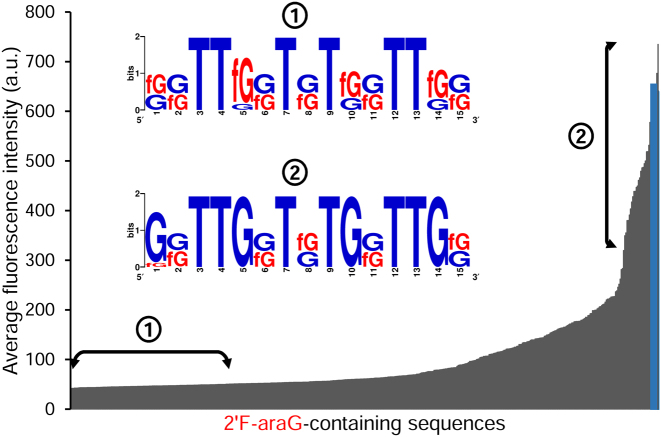
Figure 4.
Average fluorescence intensities of all possible sequence permutations containing 2΄F-araG (29, 512 sequences) at a [Thr] of 200 nM. The control (unmodified) TBA1 is shown in blue. The left double arrow marks the region of poor binders used to extract the sequence logo shown in the inset (from 40 to 50 a.u). The right double arrow marks the region of better binders used to extract the sequence logo shown in the inset (from 250 to 740 a.u). Sequence names are omitted for clarity.

