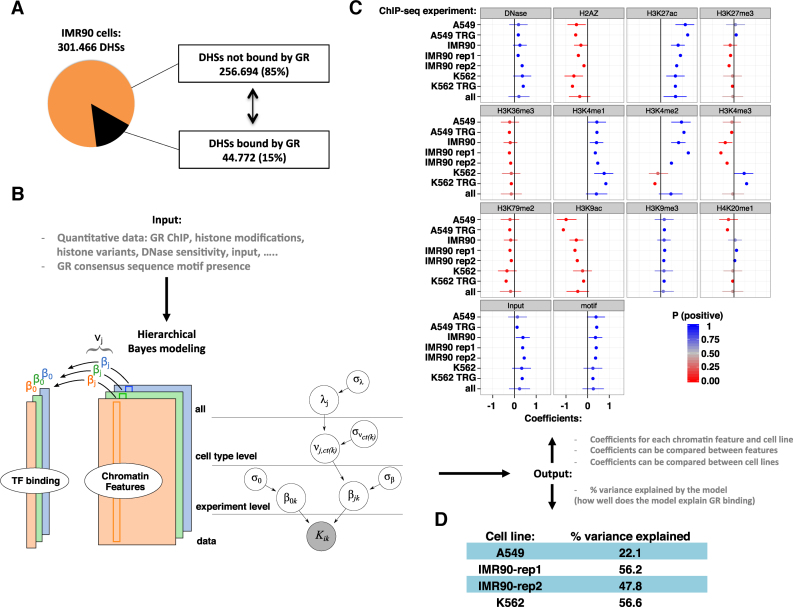
Figure 2.
GR binding in the universe of open chromatin. (A) Pie chart showing the percentage of all DHSs in IMR90 cells occupied by GR (15%) in black. (B) Left: The hierarchical Bayesian model for a single cell type to model the read density of GR binding (tall colored columns), based on various chromatin features (colored rectangles). Right: The full hierarchical model. The grey node at the bottom indicates the data. As output, the model generates coefficients (β) for each chromatin feature and for each experiment. Experiments on the same cell type share a common effect (ν), and all cell types share a common effect λ. (C) Estimated coefficients for all levels of the model, with cell type, lab and replicate number indicated e.g. A549 TRG. The cell type parameters (ν) are indicated with only the cell type e.g. A549. The parameter λ is labeled ‘all’. Dots mark the posterior mean; whiskers indicate the 95% quantile-based interval. P (positive) from 0 to 1 indicates the posterior probability of the coefficient having a positive impact on GR binding, according to the posterior distributions obtained from the hierarchical Bayesian model. (D) % variance explained by the model for each of the cell lines.

