Figure 4.
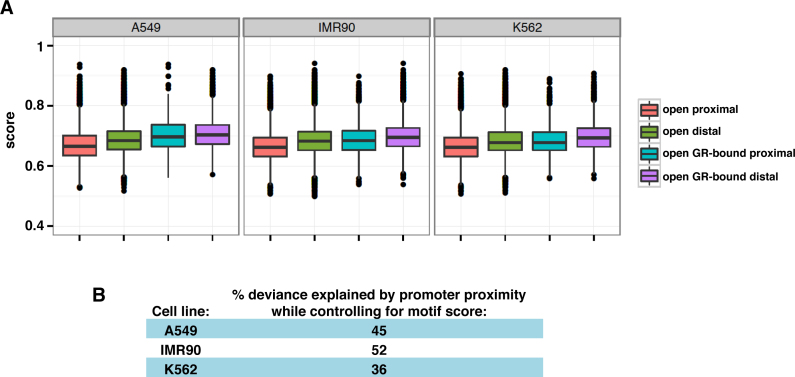
Role of sequence composition in explaining the promoter–proximal depletion of GR binding observed. (A) Distribution of GR motif score (GR motif MA0113.1 from JASPAR, (23)) for the following groups: All promoter–proximal DHSs (salmon), all distal DHSs (green), for GR-bound proximal DHSs (turquoise) and GR-bound distal DHSs (purple) for cell lines as indicated. (B) Percent deviance of GR peak presence at DHSs explained by promoter proximity while controlling for motif score, as a percent of the deviance explained by the motif score alone indicates that motif score distribution explains some, but not all promoter–proximal depletion of GR binding.

