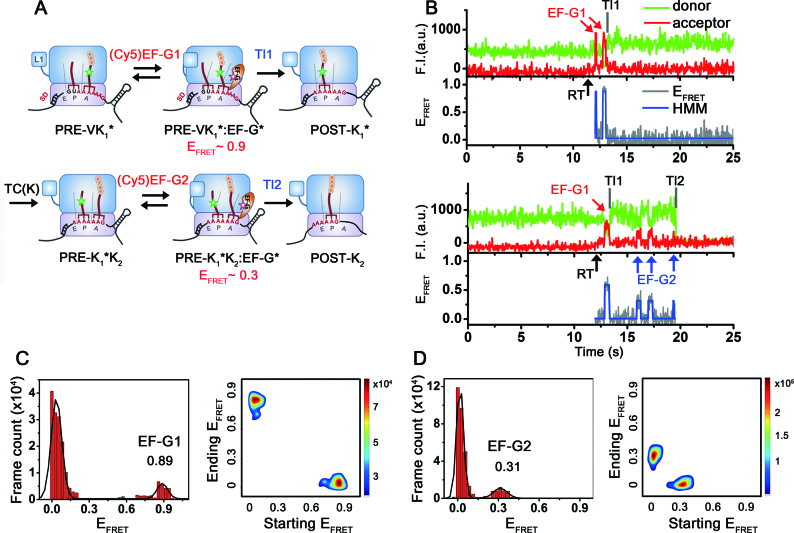
Figure 2.
Schematic drawings of ribosomal complexes translating through the mRNA, and representative fluorescence time traces and corresponding EFRET states. (A) Schematic drawings of ribosomal complexes during two rounds of translational elongation cycles on the dnaX mRNA monitored by single-molecule FRET experiments. A post-translocation ribosomal complex (POST-V) was enzymatically formed in bulk and contained peptidyl-tRNAVal on the P-site. The complex was immobilized on the surface via hybridization at the 5΄-end with a surface-immobilized DNA strand. A pre-translocation complex (PRE-VK1*), which contains tRNAVal in the P-site and peptidyl-(Cy3)tRNALys in the A-site, was formed on the surface by delivering a ternary complex of EF-Tu(GTP)-Lys(Cy3)tRNALys in the absence of EF-G. PRE-VK1* and PRE-K1*K2 complexes are likely in conformational fluctuations between classical and hybrid states. (B) Representative time traces of fluorescence signals of the dnaX-ribosomal complexes upon real-time (RT, black arrow) delivery of 100 nM (Cy5)EF-G to the PRE-VK1*. The PRE-VK1* complexes were identified by Cy3 signals at the beginning of imaging. Delivery of (Cy5)EF-G triggered excursions of high FRET states (red arrow), indicating accommodation of (Cy5)EF-G near the (Cy3)tRNALys. Later on, Cy5 signals disappeared, while Cy3 intensity slightly increased. The observation is consistent with the published results that a slight increase of the Cy3 signal on the tRNA was assigned to the translocation of the tRNA from the A-site to the P-site (34). Slight increase of the Cy5 background signal is due to the floating (Cy5)EF-G. Bottom trace is a representative time trace of fluorescence signals of dnaX-ribosomal complexes upon co-delivery of (Cy5)EF-G and non-fluorescently labeled TC(K) to the PRE-VK1*. First round of translocation (Tl1) by binding of (Cy5)EF-G1 (red arrow) and the second translocation (Tl2) process with (Cy5)EF-G2 bindings (blue arrows) and changes on the fluorescent signals are observed. Time traces were manually divided into two blocks for further analysis; block 1: from RT to Tl1, block 2: Tl1 to Tl2. (C) FRET histogram and transition density plot of block 1: from RT to Tl1. FRET state of ∼0.9 corresponds to EF-G bound state to PRE-VK1*. (D) FRET histogram and transition density plot of block 2. FRET state of ∼0.3 corresponds to EF-G bound state to PRE-K1*K2. Transitions from 0 to 0.9 or 0.3 FRET correspond to binding of (Cy5)EF-G1 and (Cy5)EF-G2, while transitions from 0.9 or 0.3 to 0 correspond to dissociation of them, respectively.

