Figure 3.

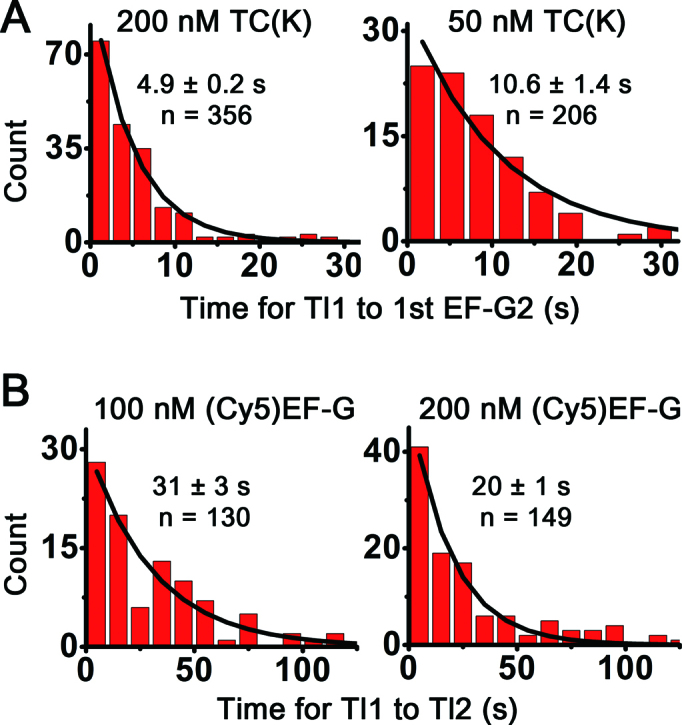
TC(K) and (Cy5)EF-G concentrations-dependent reaction time changes. (A) TC(K) concentration dependent reaction times from Tl1 to the first binding of (Cy5)EF-G2. As decreased in TC(K) concentration from 200 M to 50 nM at constant 100 nM (Cy5)EF-G, the binding of the EF-G2 took longer by almost twice as much. Excitation laser power was 6.5 mW with time resolution of 35 ms/frame and photo-bleaching half lifetimes was measured to be ∼60 s. (B) (Cy5)EF-G concentration dependent reaction time from Tl1 to Tl2. Fast Tl2 was observed as increase in the (Cy5)EF-G concentration from 100 to 200 nM while keeping [TC(K)] at 250 nM. Excitation power was 4 mW with time resolution of 100 ms/frame and photo-bleaching half lifetimes was measured to be ∼90 s. n is the number of traces. Mean reaction times were obtained by fitting the histograms to single exponential decay curves and errors are propagated standard errors.
