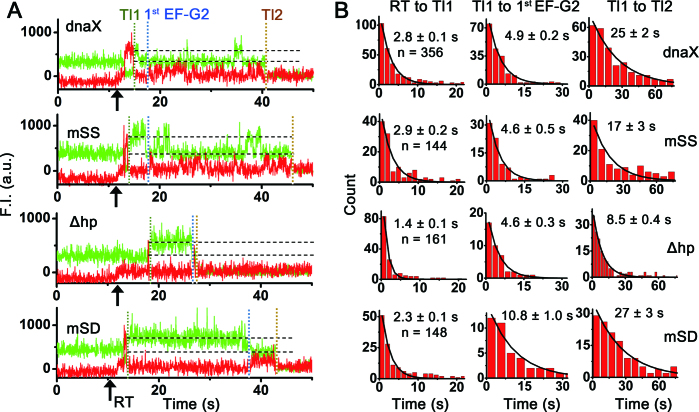
Figure 4.
Comparisons of characteristic fluorescence time traces and reaction times between mRNAs upon delivery of 100 nM (Cy5)EF-G and 200 nM TC(K). (A) Representative time traces of fluorescence signals of each mRNA construct upon co-delivery of (Cy5)EF-G and non-fluorescently labeled TC(K) to the PRE-VK1*. (B) Comparisons of reaction times between the different mRNA constructs. Translocation rate of the first Lys slippery codon (Tl1, left), reaction times from the Tl1 event to the first EF-G2 binding (first EF-G2, middle) and from Tl1 to the second Lys slippery codon translocation event (Tl2) (right) (from top to bottom, dnaX, mSS, Δhp and mSD). n is the number of traces. Mean reaction times were obtained by fitting to single exponential decay curves and errors are propagated standard errors. In both reaction times, Δhp showed faster reaction than the other three constructs that contained the hairpin structure. Reaction times for the Tl2 are much slower than Tl1 for all the mRNA constructs.

