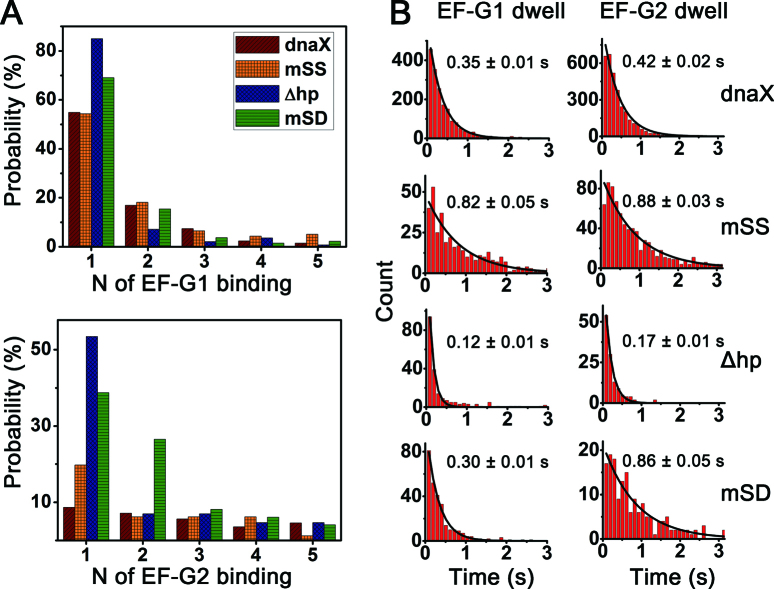
Figure 5.
Comparisons of the number of EF-G bindings required per a translocation and of the bound EF-G dwell times upon delivery of 100 nM (Cy5)EF-G and 200 nM TC(K). (A) Percentage of traces translocated by consuming corresponding number of EF-G bindings for each mRNA; EF-G1 for the Tl1 (upper) and EF-G2 for the Tl2 (bottom). In counting the number of EF-G2 binding events for the Tl2, only the traces showing clear EF-G2 binding events were considered (dnaX: 62%, mSS: 58%, Δhp: 27%, mSD: 34%, Supplementary Table S1). The counted numbers must be biased toward lower numbers, since the EF-G2 binding states probed by low FRET state (∼0.3) were often missed during idealization process. (B) Dwell times of EF-G1 and EF-G2 for each mRNA construct.

