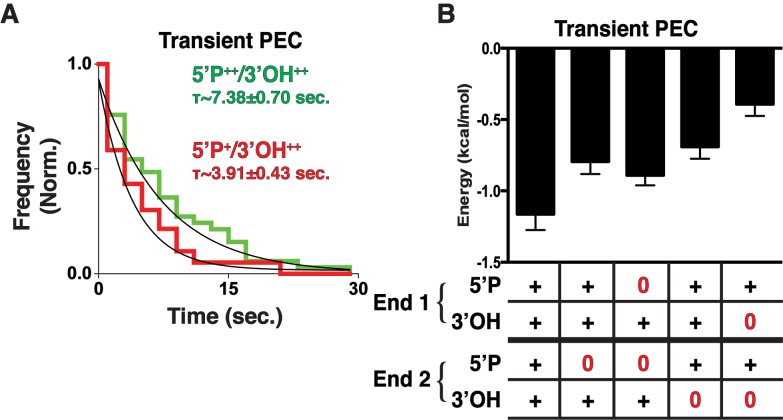
Figure 5.
Analysis of Transient PECs. (A) Dwell time histograms and fit (black) of transient PECs for 5΄P++/3΄OH++ (green) and 5΄P+/3΄OH++ (red) and fit (black). Ends containing both 5΄P have longer associations than those lacking a 5΄P. (B) Energy stability of Transient PECs for ends lacking 5΄P and 3΄OH. Error bars are the SEM of the dwell time exponential fit.

