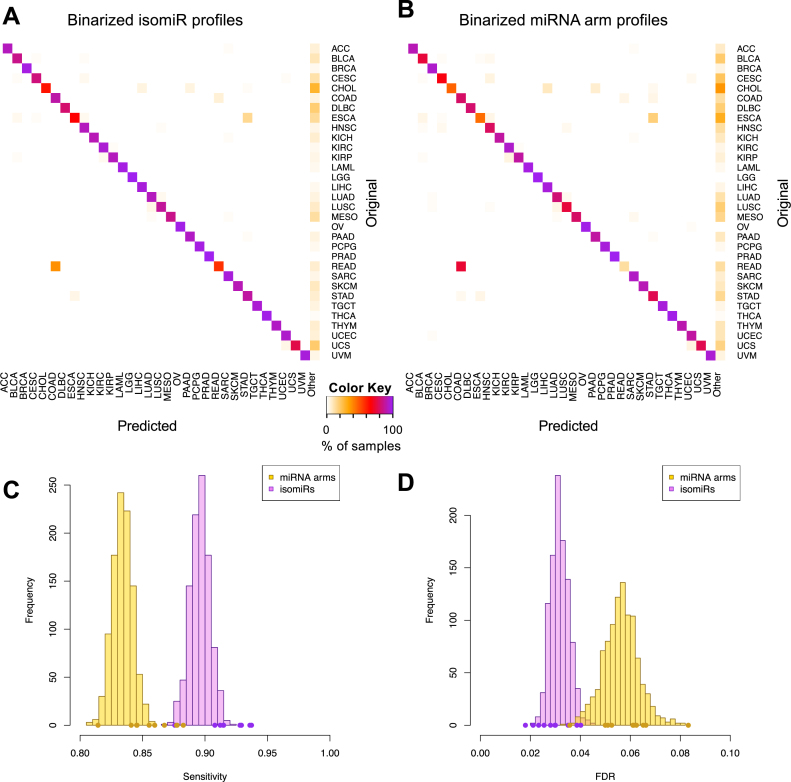
Figure 3.
Support vector machines (SVMs) correctly classify 32 cancer types. (A and B) SVM classification using the binarized isomiR (A) or the miRNA arm (B) expression profile. Each row of the heatmap represents the original and each column the predicted cancer class. The color of each cell in the heatmap is proportional to the percentage (%) of samples originally as the cancer type in the respective row to be predicted as the cancer type of the respective column. The % is calculated as the average across 1 000 iterations. (C and D) Sensitivity (C) and FDR (D) scores for the SVM models built using the binarized isomiR (magenta) or miRNA arm (yellow) expression profiles. The points at the bottom of the distribution represent the sensitivity (C) and FDR (D) scores from the 10-fold cross-validation analysis.

