Figure 3.
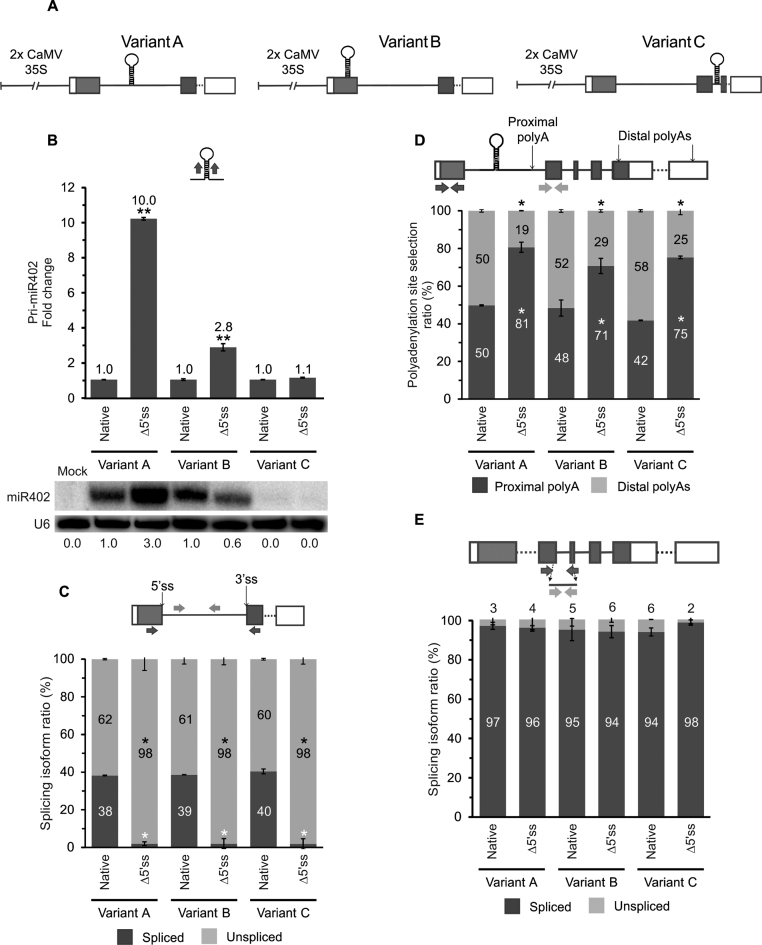
The efficiency of miRNA biogenesis depends on the pre-miR402 location within its host gene. (A) The scheme of the At1g77230 gene construct variants: A (wild-type), B (the miR402 stem-loop moved into the first exon) and C (the miR402 hairpin moved into the second intron). (B) The pri-miR402 (upper panel) and mature miR402 (lower panel) levels measured using RT-qPCR and northern blot (U6 was used as a loading control), respectively. Numbers below the blot image are relative intensities of the miRNA bands. Mock represents the sample of Nicotiana leaves infiltrated only with buffer (negative control). RT-qPCR analysis of (C) the At1g77230 first intron splicing efficiency, (D) the proximal and distal polyA site selection and (E) At1g77230 second intron splicing efficiency. Arrows in the upper parts of the panels with the At1g77230 gene scheme depict the primers used (B–E). Native and Δ5΄ss mean active and inactivated miR402-carrying intron 5΄ss, respectively. Error bars indicate SD (n = 3), and asterisks indicate a significant difference between the sample and control (*P < 0.05; **P < 0.01; white stars—for spliced or proximal polyA isoforms; black stars—for unspliced and distal polyA isoforms (C-D)).

