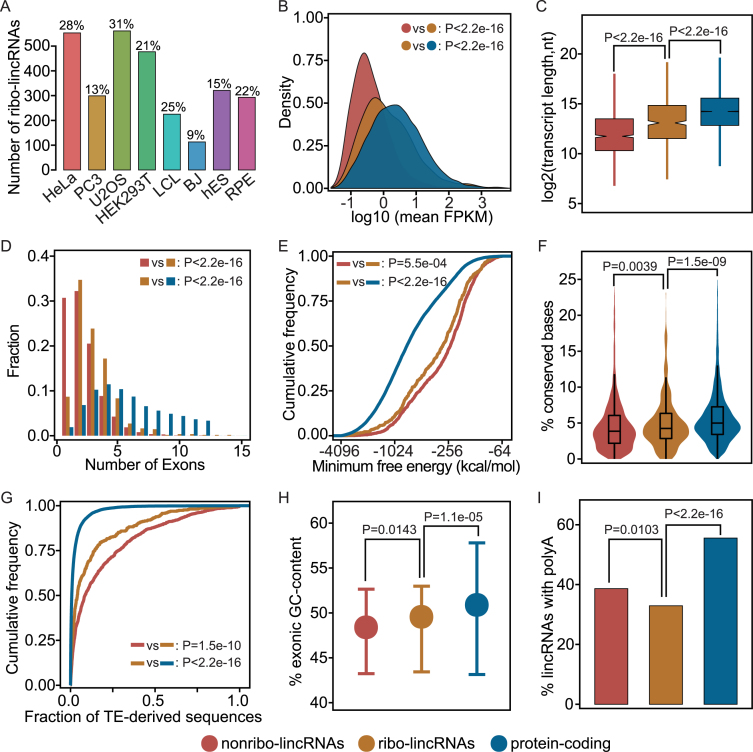
Figure 1.
General characteristics of lincRNAs and protein-coding genes. (A) Percentage of lincRNAs occupied by ribosomes in each cell line. The number of ribo-lincRNAs for each cell line is given at the top of each bar. (B) Density plots of the expression levels; (C) Box-and-whisker plots of transcript lengths; (D) Distributions of exon numbers; (E) Cumulative distribution plots of minimum free energy; (F) Violin plots of the base-wise conservation fraction; (G) Distributions of TE-derived sequences in exons; (H) Distributions of GC-content. Error bars represent interquartile range; (I) Fractions of transcripts containing polyA features, shown here for a representative cell line (HeLa). To avoid duplication of presentation, other cell lines are shown in Supplementary Figures S3–8 and Tables S2–8.

