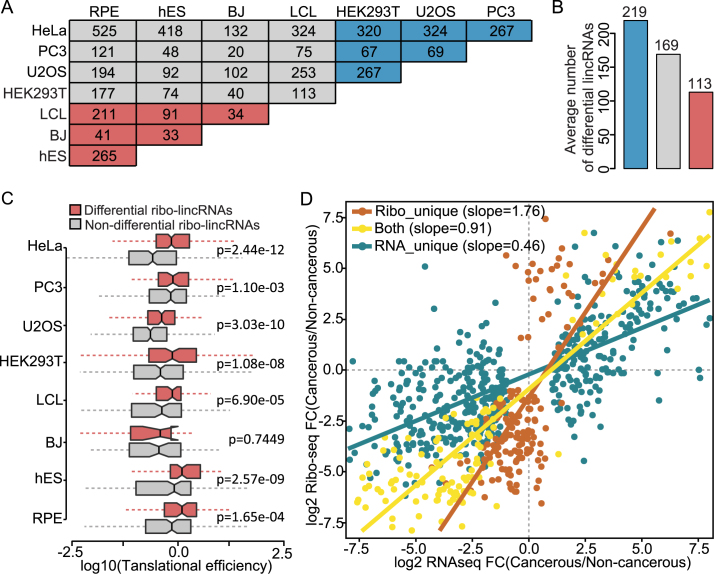
Figure 4.
Scope and characteristics of lincRNAs translation in different cell lines. (A) Overlap of differential translation lincRNAs between different cell lines. Notably, 2-fold change and FDR < 0.05 are used as the determination of differential translation. (B) Comparison of average number of differential translation lincRNAs in different cell types. Blue and red colors represent cancerous and non-cancerous cell lines, respectively. (C) Translational efficiencies of differential and non-differential translation ribo-lincRNAs in each cell line. (D) Scatter plot showing the differences in regulation levels between cancerous and non-cancerous cell lines for different categories of lincRNAs. Red, yellow and blue slopes demonstrate translational regulation for lincRNAribo_unique, lincRNAboth and lincRNARNA_unique, respectively.

