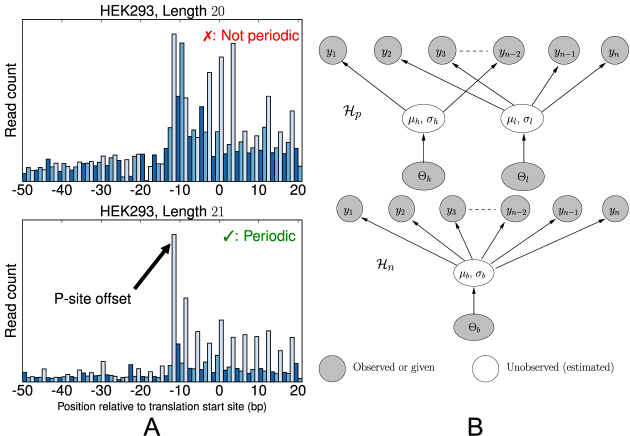
Figure 1.
(A) Metagene profiles from a HEK293 dataset for reads with length 20 bp (top) and 21 bp (bottom). The reads of length 21 bp show a clear 3-nt periodicity, while those of length 20 bp do not. (B) Simplified view of graphical models for estimating the periodicity of metagene profiles. (Top) The periodic model, H_p, is a two-component mixture model in which the count of the first nucleotide of each codon is drawn from a ‘high’ component h while the other two nucleotides’ counts in the codon are drawn from a ‘low’ component l. That is, this model fits the ‘high-low-low’ pattern of translating ribosomes. (Bottom) The non-periodic model, H_n, is a naïve Bayes model in which all nucleotide counts are drawn from the same distribution.

