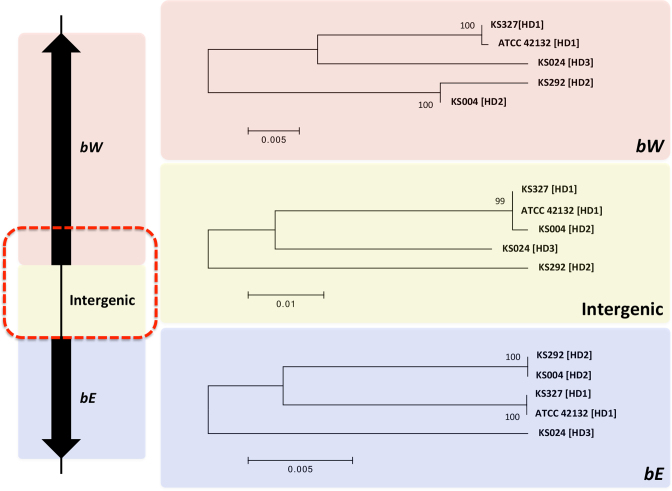
Figure 8.
Phylogeny of the three components of the HD locus. Shown on the left is a schematic diagram of the HD locus. The red dashed rectangle indicates the region where the HD2 allele of isolate KS004 is identical to the HD1 allele (see text). Shown on the right are the phylogenies of the five M. sympodialis genomes (see Table 3) for each of the three components of the HD locus. Scale bars indicate the number of substitutions per site. Bootstrap values are based on 1000 replications.

