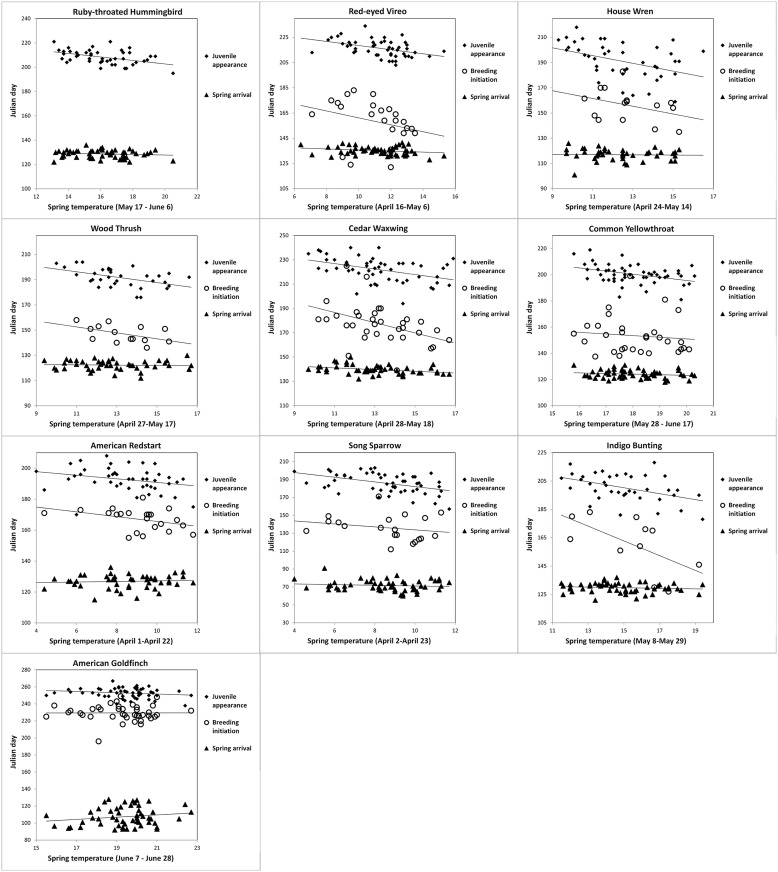
Fig 2. Phenology comparison for three events as a function of spring temperature for 10 migratory bird species.
The events are timing of juvenile appearance (Julian day at which 10% of young were captured), breeding initiation (Julian day at which 10% of females in breeding condition were captured), and spring arrival (Julian day at which 10% of spring adult migrants were captured). Mean spring temperature for each species was calculated from the three-week time period most correlated with the time interval between spring arrival and juvenile appearance each year (Table 1). Bird data were collected from 1961–2014 at a constant effort mist-netting station in Pennsylvania.

