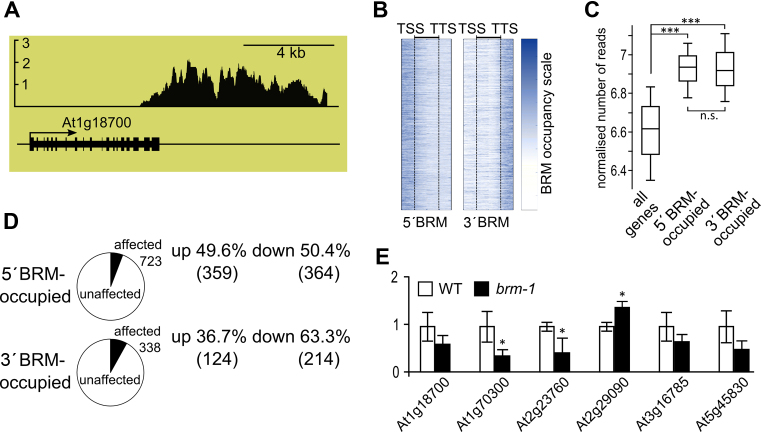
Figure 3.
Characterization of 3΄ BRM bound genes. (A) Example of 3΄ BRM-occupied gene (At1g18700) from whole-genome ChIP-chip using anti-BRM antibodies, y-axis represents BRM enrichment. (B) BRM occupancy along genes; genes with BRM bound at 5΄ end or near 3΄ end are shown. TSS and TTS represent aligned transcription start and transcription termination sites, respectively, of genes in each class. (C) Expression levels of all, 5΄ and 3΄ BRM-occupied genes using RNAseq data from (47). Asterisks indicate significant differences between the 5΄BRM and 3΄BRM groups (Wilcoxon signed-rank p-test; *** P < 0.001; n.s. not significant). (D) Comparison of expression of 5΄ and 3΄ BRM-occupied genes in brm-1 null mutant and WT plants. (E) RT-qPCR analysis of mRNA expression for selected 3΄ BRM-bound genes in brm-1 mutant and WT. * significant change between brm-1 and WT (t-test, P < 0.05).

