Figure 4.
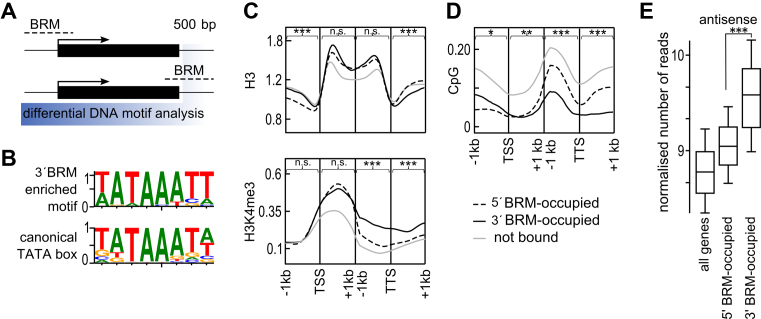
TTS regions occupied by BRM act as promoters of antisense transcription. (A) Schematic of de novo motif discovery procedure used to define motifs enriched in 500 bp region behind TTS (highlighted in blue) of 3΄BRM-occupied genes. Black rectangles represent genes and dashed lines indicate BRM binding sites. (B) Weblogo of discovered motif, with canonical TATA box motif shown below, y-axis – information context. (C) Genes were grouped based on BRM occupancy into 5΄, 3΄ and BRM – not bound, and for each class occupancy profiles along a 1 kb region around TSS and TTS were plotted. Top to bottom occupancy profile of H3 and H3K4me3, using published ChIP-seq data (58–59). (D) CG DNA methylation profiles for 5΄BRM, 3΄BRM and BRM – not bound genes for a 1 kb region around TSS and TTS were plotted based on (61). (E) 3΄BRM-occupied genes show high antisense levels. RNAseq data (47) were combined, normalized for gene length and average for each gene category was plotted. Asterisks in C, D and E indicate significant differences between the 5΄BRM and 3΄BRM groups (Wilcoxon test, *P < 0.05; **P <0.01; ***P < 0.001; n.s. not significant).

