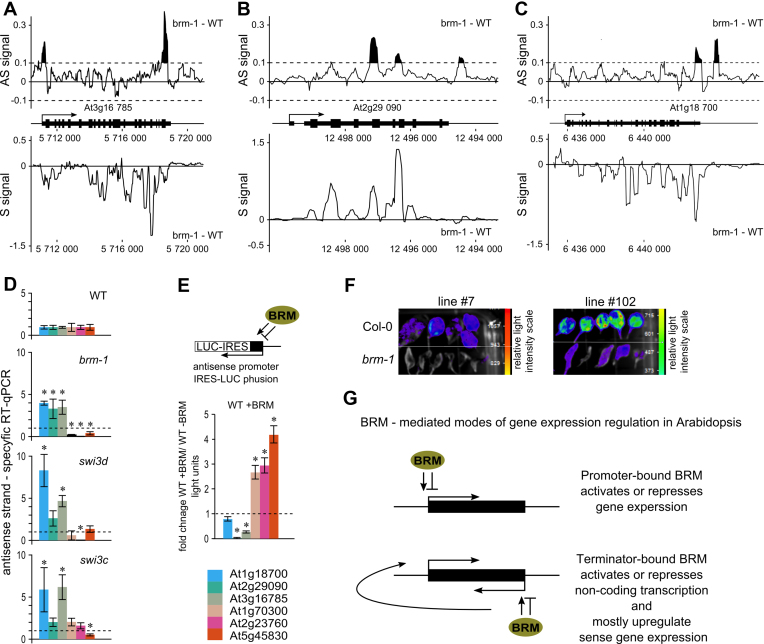
Figure 5.
SWI/SNF complex regulates antisense transcription. (A, B and C) Difference (brm-1 – WT) in intensity for antisense (AS signal) and sense (S signal) expression values from whole genome tilling arrays was plotted along the selected target genes. Negative values indicate down and positive up regulation. For the antisense signal a cut-off value of 0.1 (black filled picks) was used to indicate changes in antisense expression above background. (D) Mutants in SWI/SNF subunits show misregulation of antisense transcription. Strand specific RT-qPCR quantification of antisense transcripts at selected 3΄BRM-bound genes. (E) BRM controls antisense transcription from TTS regions of 3΄BRM-occupied genes. TTS regions of selected genes were cloned into luciferase marker gene (LUC) reporter construct and used for transient co-transformation of Arabidopsis Col-0 (WT) seedlings with or without BRM expression construct. Data represent fold change in LUC activity upon BRM overexpression relative to seedlings transformed with empty expression vector; data are mean ±SE for at least 20 individually transformed plants. (F) pAS-At5g45830::LUC transgene was transformed into BRM/brm-1 plant line. brm-1 heterozygotes segregating 3:1 for the transgene were selected and their offspring were genotyped to select WT and brm-1 homozygous plants. Data for two independent transformants (line #7 and #102) are shown. (G) Model of 5΄BRM driven activation or repression of gene expression (Top), and 3΄BRM driven regulation of antisense transcription leading to concomitant sense gene regulation (Bottom). * significant change (t-test, P < 0.05).

