Figure 3.
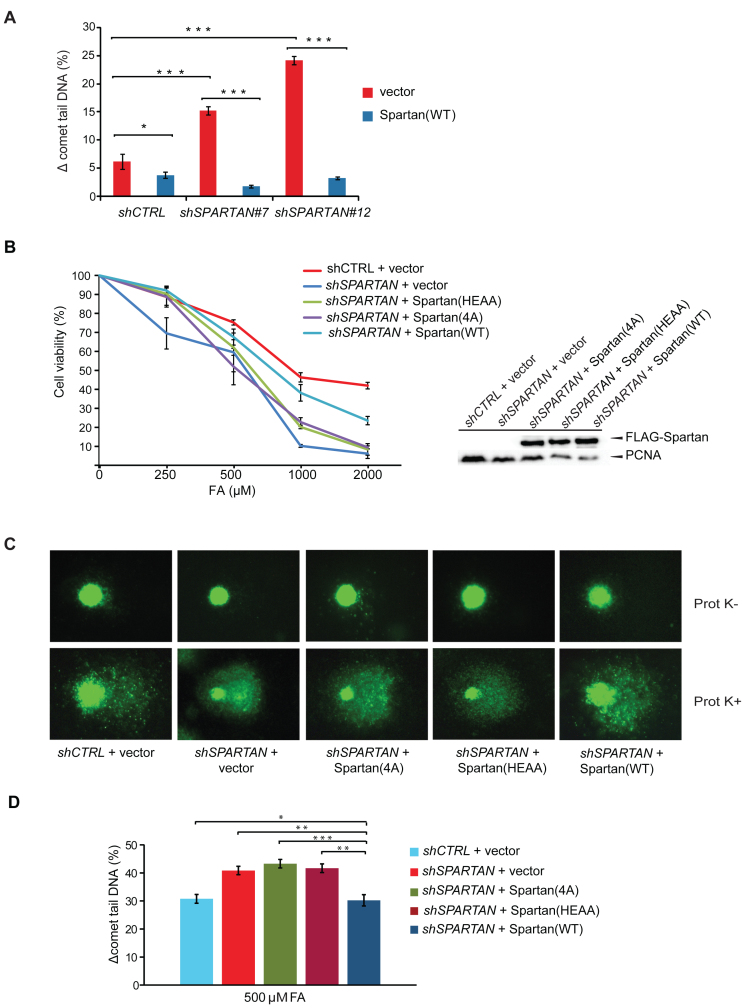
The DNA-binding and the protease domains of Spartan contribute to cell resistance against DPC. (A) Complementation of Spartan-silenced cells. Ectopic expression of silencing-resistant Spartan complemented the DPC-repair deficiency of Spartan-silenced cells as revealed by the Prot K-modified BrdU comet assay. Cells were treated with 500 μM FA for 2 h, harvested after 3 h recovery followed by 100 μM H2O2 treatment. Two independent SPARTAN stable knockdown cell lines (Spartan #7 and #12) were assayed, and ± standard error of the mean was calculated from three independent experiments. Statistical analysis was made by Student's t-test. Statistical significance was labelled by *P < 0.05, **P < 0.01, ***P < 0.001. (B) Cell viability assay of HEK 293 cells depleted of endogenous Spartan expressing siRNA-resistant FLAG-tagged Spartan or Spartan(4A) mutant or Spartan(HEAA) mutant proteins. Resazurin Fluorometric Cell Viability Assay was performed after 2 days of mock or FA treatment. Percentage of viability was calculated by defining the viability of untreated HEK 293 cells stably expressing the corresponding shRNA as 100%. Error bars indicate ± standard error of the mean from three independent experiments. The expression of the siRNA-resistant wild-type and mutant Spartan proteins are verified with α-FLAG antibody in Western blot analysis. (C) The DNA-binding and the SprT domains of Spartan are required for DPC-removal. Representative images of FA-treated cells analysed by the DPC-specific BrdU comet assay. HEK 293 cells stably expressing control shRNA were transfected with FLAG-empty vector expressing FLAG and cells stably expressing SPARTAN shRNA were transfected with FLAG-empty vector, siRNA-resistant FLAG-tagged SPARTAN(4A) mutant, siRNA-resistant SPARTAN(HEAA) mutant or siRNA-resistant SPARTAN(WT). (D) Quantitation of post-replication repair of DPC-containing DNA in cells expressing DNA-binding- and SprT-mutant Spartan proteins. Three independent experiments as shown in Figure 3C were quantitated, and ± standard error of the mean was calculated. Statistical analysis was made by Student's t-test. Statistical significance was labelled by *: P < 0.05, **: P < 0.01, ***: P < 0.001.

