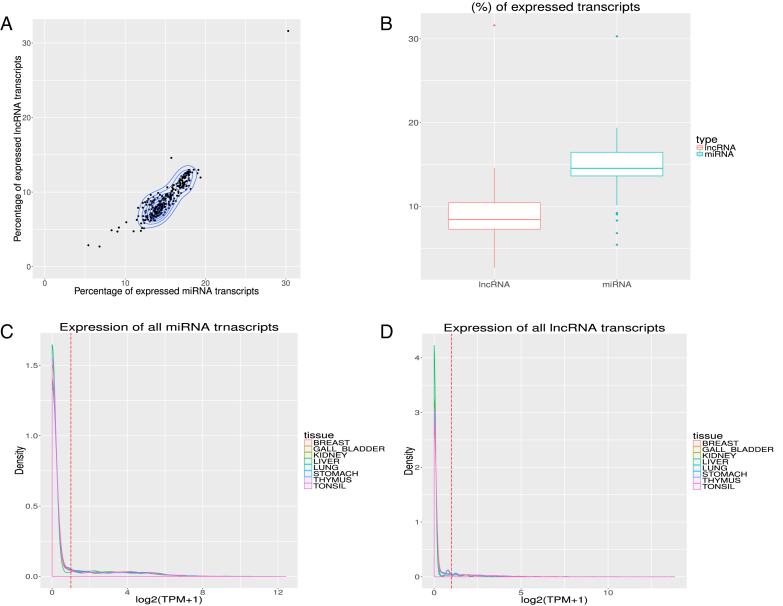
Figure 2.
Expression of of RNA transcripts in different tissues/cells. Subfigure (A) shows scatter plot with contour overlay and (B) shows the box plot for the fraction of transcripts from miRNA and lncRNA having expression >1 TPM in different tissues/cells. Subfigure (C) and (D) highlight the distribution of expression for miRNA and lncRNA transcripts in several tissues. Vertical red dashed line highlights the one TPM (normalized TPM using the relative log expression (RLE) method in edgeR) threshold.

