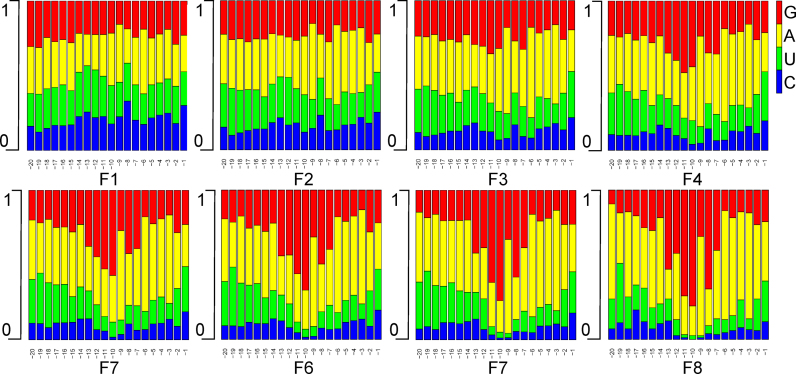
Figure 3.
Influence of the nucleotide sequence of 20 nt fragments in 5΄-UTRs on the translation efficiency. Panels F1–F8 correspond to fractions sorted by the translation efficiency from the least efficient F1 to the most efficient F8. Each bar represents a proportion of nucleotides at the corresponding position in the 5΄-UTR relative to the AUG start codon, as shown below the graphs. Nucleotides are color-coded as shown in the legend at the upper right side of the figure G – red, A – yellow, U – green, C – blue. A related Supplementary Figure S5 contains the data on the positional nucleotide composition of 5΄-UTRs with for randomized 30 nt fragments.

