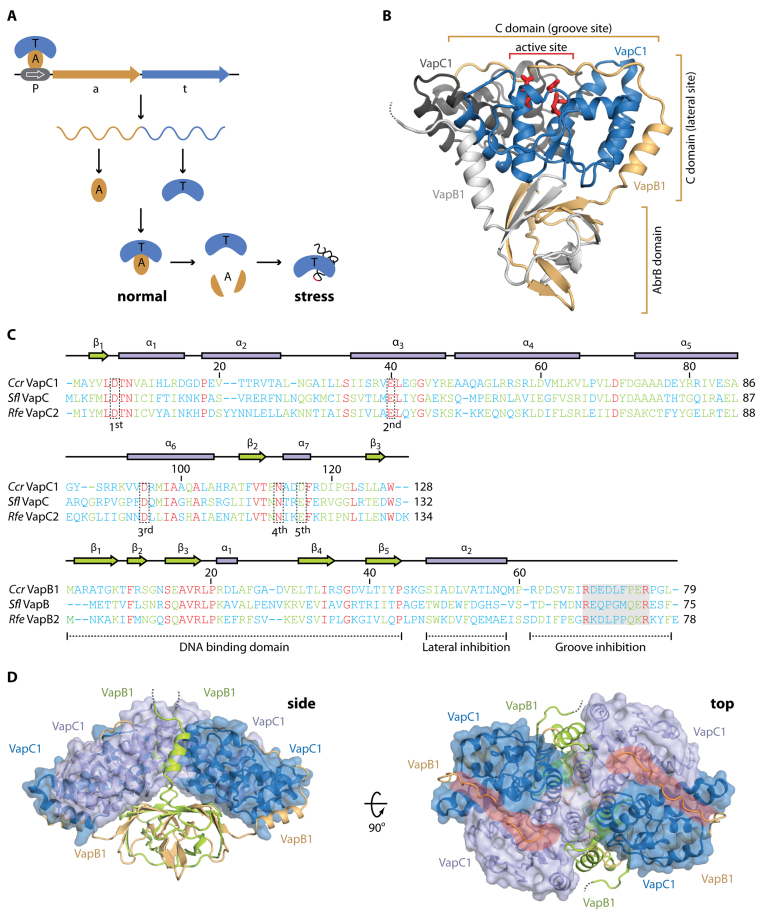
Figure 1.
Overall structure of the C. crescentus CB15 VapBC1 complex. (A) Overview of the genomic organization and regulation of type II TA systems including VapBC. The TA locus consists of a promoter (P), antitoxin (a) and toxin (t) genes that give rise to a single mRNA expressing two separate proteins, A (light brown) and T (blue) that associate into a stable complex under normal growth conditions. During stress, the antitoxin is degraded by cellular proteases activating the toxin, which is a functional RNase targeting specific stable RNA species, including tRNA (lower right). Transcription from the TA locus is auto-regulated by binding of the TA complex to the promotor (P, top left). (B) Overview of the apo VapBC1 heterotetrameric structure with the location of the active site indicated by red sticks. One VapC1 toxin is shown in blue and the associated VapB1 antitoxin in light brown with the N-terminal AbrB domain and two interaction areas with the toxin indicated. The other VapC1 and VapB1 molecules of the tetramer are shown in dark and light grey, respectively, to highlight the TA interaction. The disordered VapB C terminus is shown with a dashed line. (C) Structure-based sequence alignment and secondary structure of the Caulobacter crescentus (Ccr) VapC1 and VapB1 proteins with the Shigella flexneri VapBC (Sfl, PDB ID 3TND) and Rickettsia felis VapBC2 (Rfe, PDB ID 3ZVK) structures (12,13). Sequence numbers correspond to the Caulobacter sequence. Conserved active site residues in VapC are indicated by dashed boxes (1st, 2nd, 3rd, 4th and 5th) and functional regions of VapB are indicated below the sequence (dashed lines). The region containing the pseudo-palindromic protein sequence in the VapB C-terminus is likewise indicated (shaded box). The sequences have been aligned using PROMALS3D (42) and are coloured by the level of similarity (blue = dissimilar, green = some similarity, red = identical). (D) Two orthogonal views of the heterooctameric apo VapBC1 complex formed by crystallographic symmetry. The VapC1 toxins are shown in light/dark blue with a semi-transparent surface and the VapB1 antitoxins in light brown/lime. The side view shows the protruding AbrB domains while in the top view, the positively charged grooves are shown with red. The disordered VapB C termini are shown with dashed lines.

