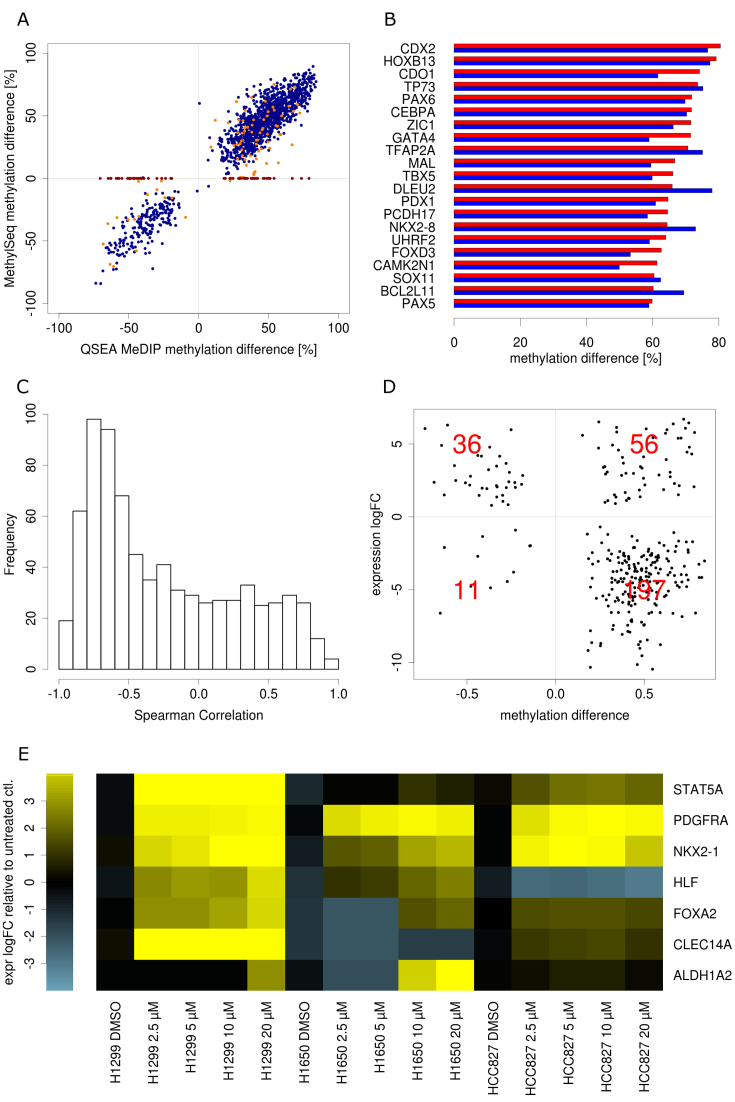
Figure 4.
Validation and functional interpretation of differentially methylated Regions: (A) Scatterplot of methylation difference from QSEA methylation estimate and Methyl-Seq of CpG island promoter DMRs. Blue: directly covered by Methyl-Seq. Orange: neighbourhood covered by Methyl-Seq, red: not covered by Methyl-Seq. (B) Methylation difference of 20 most hypermethylated tumour suppressor genes form QSEA estimates (red) and Methyl-Seq(blue). (C) Histogram of correlation between CpG island promoter methylation and gene expression. (D) Mean methylation difference versus gene expression log2 ratio of differentially expressed genes with differentially methylated CpG island promoter. Red numbers are gene counts per quadrant. (E) Gene expression in four NSCLC cell lines after demethylation validation experiment.

