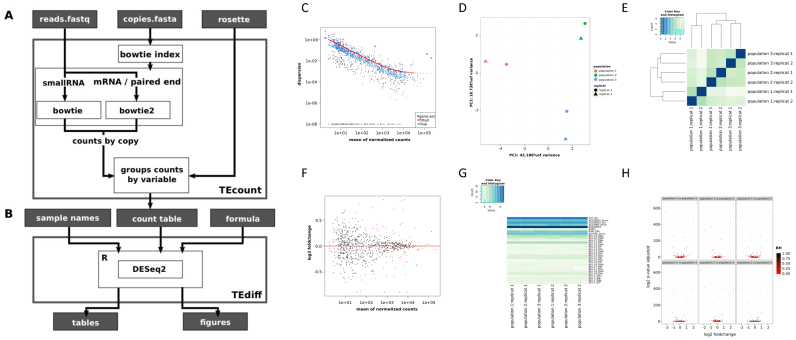
Figure 1.
Workflow of the TEtools pipeline and the different outputs that can be obtained. (A) Details of the TEcount module, which uses reads in fastq format, TE sequences in fasta format and a rosette file (see text) as input. (B) Details of the TEdiff module, which uses DESeq2 to perform the differential analysis of expression and produces result files in tables and figures. Examples of the various figures produced by the TEdiff module are presented from C to H. (C) Model goodness of fit of the data. (D) Principal component analysis of the different samples with their replicates. (E) Heatmap of the various samples. (F) MA plot of all samples. The red dots correspond to significant differences. (G) Heatmap corresponding to the expression levels of each variable for the various samples and replicates. (H) Volcano plots of all pairwise sample comparisons. The figures were obtained with three strains from our mRNA data.

