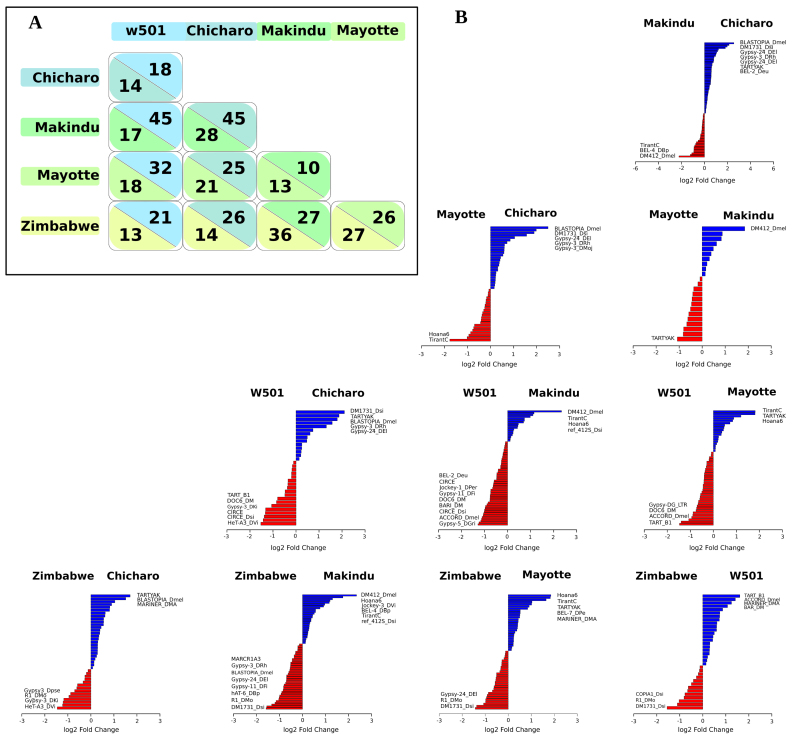
Figure 3.
Differentially expressed TEs between strain pairs. (A) Numbers of differentially expressed TE (sub)families between strains. The comparisons were performed between pairs of strains. Numbers above the diagonal indicate the numbers of more highly expressed TEs for the strains in columns, numbers above the diagonal indicate the numbers of more highly expressed TEs for the strains in rows. Each color corresponds to a different wild-type strain. (B) Pairwise log2-fold change for each differentially expressed TE family. The names of the most differentially expressed TEs are indicated. Blue and red indicate the sense of the comparison.

