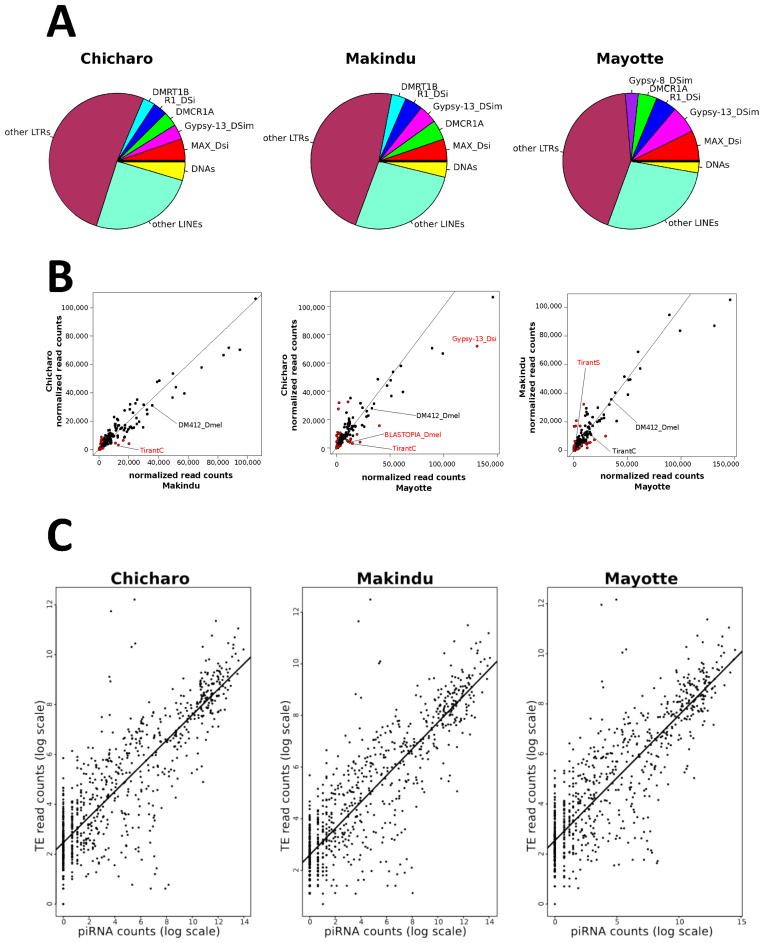
Figure 4.
Normalized piRNA read count analysis. (A) piRNA production in the different strains. The more abundant piRNAs are identified in the picture and are the same in all the strains. (B) Comparison of the normalized piRNA read counts for each pair of strains. Red dots indicate piRNAs with a log2-fold change >1. The black line corresponds to the 1:1 ratio line. As an example we indicate some TEs that display differential mRNA expression levels (see Figure 3). (C) Positive correlation between TE read counts and piRNA read counts for the different three strains. Pearson correlation tests on log transformed read counts: Chicharo: r = 0.857, P-value < 2.10−16, Makindu, r = 0.866, P-value < 2.10−16 and Mayotte: r = 0.860, P-value < 2.10−16

