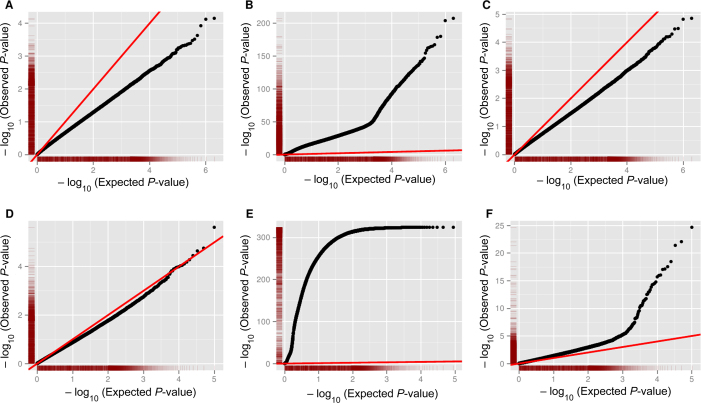
Figure 2.
The capacity of different Allele Frequencies to determine sCNAs in tumor derived cell-line samples. Each of the points in the Q-Q plots corresponds to a P-value for a pair of allelic depths from a tumor derived cell line (HCC1143) at all germ-line heterozygote SNPs in different scenarios. The red line represents the expected distribution of P-values under the null hypothesis (of no sCNA). P-values are calculated using a binomial distribution with probability of success equal to observed (A–C) germline BAF or (D–F) PHF. Deviation above this line indicates power to detect (A) sCNA using BAF on 0% tumor purity sample (i.e. normal). (B) Using BAF at 100% tumor purity. (C) Using BAF at 5% tumor purity. (D) Using PHF on a 0% tumor purity sample (i.e. normal). (E) Using PHF at 100% tumor purity. (F) Using PHF on 5% tumor purity.

