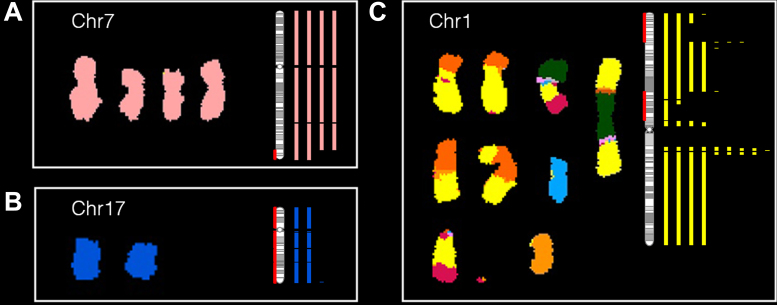
Figure 3.
dSKY plots build on SKY images to better reflect the complete copy number profile of a tumor genome. (A–C) In each of these subplots, a SKY image (reproduced with permission from (52) on the left shows the copy number of a particular chromosome, which was compared to a dSKY plot of the same chromosome – the vertical bars shown on the right in the same color. The number of the bars correspond the copy numbers at the specific regions calibrated by the chromosomal ideogram (vertical bar with grey bandings). The red shading on the ideogram is used to mark regions of loss of heterozygosity (LOH).

