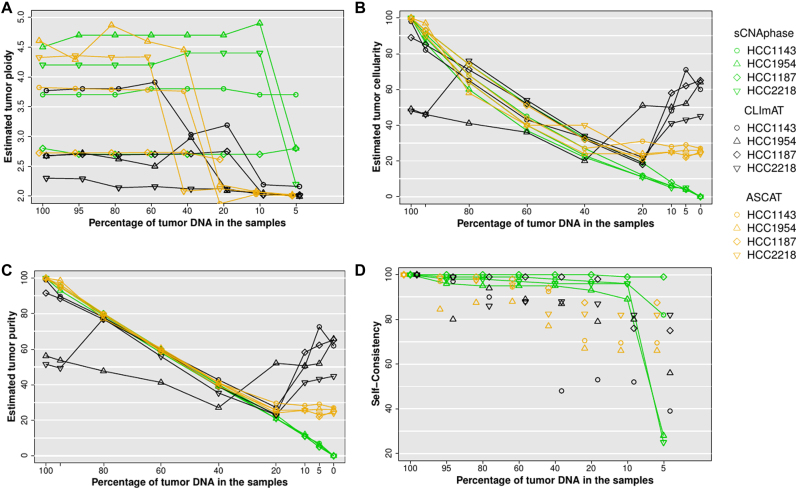
Figure 4.
(A) Inferred ploidy as a function of tumor purity. (B) Estimated tumor cellularity (the proportion of tumor cells in each sample) at different levels of simulated purity. (C) Estimated tumor purity versus simulated tumor purity (proportion of tumor DNA in sample). These purity values were calculated from estimated cellularity and estimated tumor ploidy using Equation (6) for each tool. (D) Self-consistency at decreasing tumor purity was measured as average of base-pair sensitivity and base-pair specificity versus 100% tumor sample.

