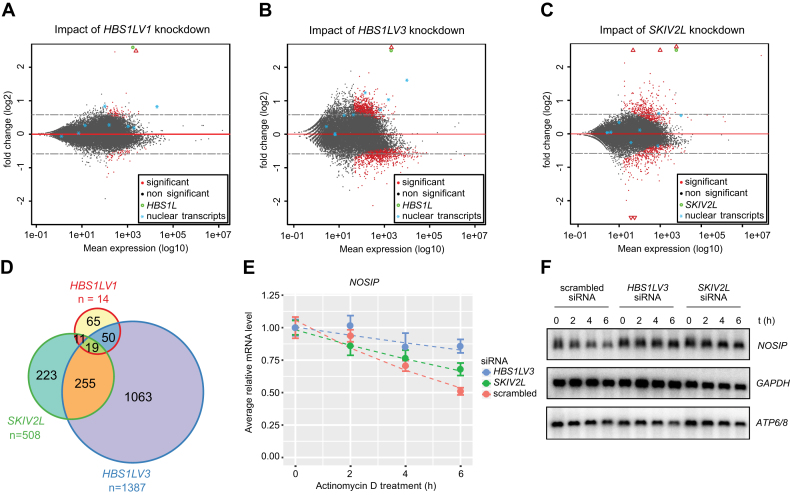
Figure 7.
HBS1LV3 depletion leads to global changes in mRNA levels. MA-plots showing log2 fold change as a function of mean expression levels on a logarithmic scale. Differential expression analysis of (A) HBS1LV1, (B) HBS1LV3, (C) SKIV2L knockdown in HEK293 cell lines rescued with overexpression of the protein of interest expressed from a siRNA-insensitive construct versus endogenous protein knockdown were analyzed. Points located below the red line represent genes with more pronounced expression in the knockdown cells relative to the rescue cell lines. Points located above the line reflect transcripts with relatively higher steady-state levels in the rescue cell lines relative to the knockdown cell lines. Using a FDR threshold of 5%, events were colored red and black for significant and not significant, respectively. Genes falling outside of the set range were plotted as empty triangles on the edge of the plot area. Nuclear transcripts shown on the plot: KCNQ1OT1, NEAT1, MALAT, XIST, TSIX, MIAT, U6 and 7SK. (D) Venn diagram showing the overlap between genes that significantly accumulated in knock down cell lines (FDR threshold of 10%). RNA-seq libraries were prepared in triplicate. (E) Relative mRNA level (y-axis) of NOSIP mRNA was measured by Real-Time qPCR following 0, 2, 4 and 6 h actinomycin D treatment. GAPDH mRNA was used for normalization. Error bar represents SEM (five biological replicates). (F) Dashed lines represent exponential decay fits. Northern blot analysis was performed using RNA from actinomycin D-treated cells, with DNA probes complementary to NOSIP, GAPDH and mitochondrial ATP6/8 transcripts (negative control).

