Figure 1.
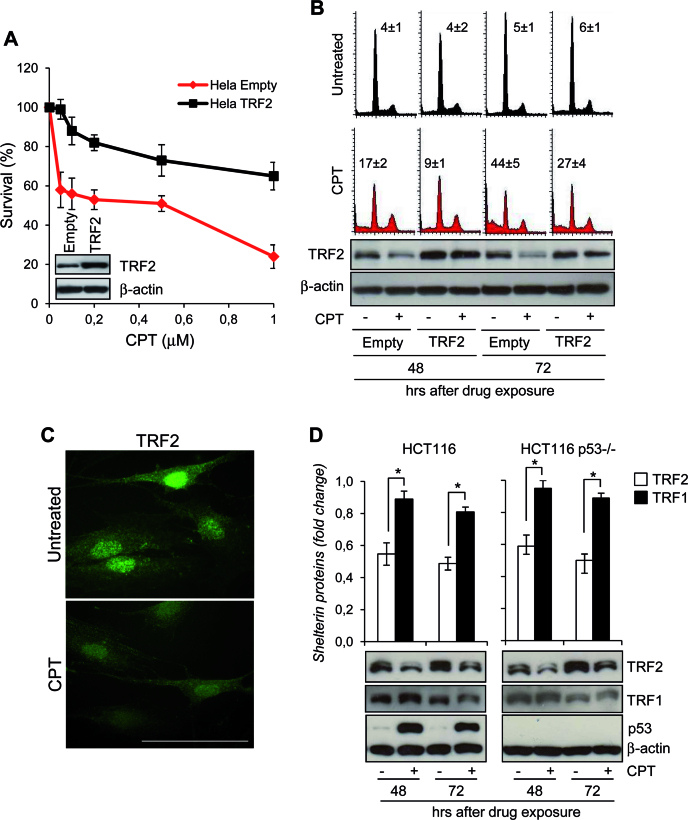
TRF2 degradation upon CPT treatment. (A) HeLa cells overexpressing TRF2 or Empty vector were treated with Camptothecin (CPT) for 2 h at the indicated doses and colony-forming ability was evaluated. The graph shows the surviving fractions calculated as the ratio of absolute survival of the treated sample/absolute survival of the control sample. Representative images of the cell lines evaluated by western blot are shown. (B) Empty- and TRF2-overexpressing HeLa cells were treated with 0.2 μM CPT for 2 h and then processed at 48 and 72 h after drug exposure for PI staining to evaluate cell cycle analysis at flow cytometry (upper panel), and western blot (WB) with the indicated antibodies to monitor the TRF2 expression levels (lower panel). The percentages of the cells at the Sub-G1 fraction of the cell cycle were reported inside the relative histograms. Representative out of three independent experiments is shown. (C) Representative immunofluorescence (IF) images of TRF2 from BJ-hTERT fibroblasts untreated or treated with 0.2 μM CPT for 2 h and fixed at 48 h after drug exposure. Original magnification, 63x. Scale bar 50 μm. (D) Expression of TRF2, TRF1 and p53 were examined by western blot in p53wt- and p53-null HCT116 cells treated as HeLa cells in A. TRF2 or TRF1 expression levels were expressed in the histograms (upper panel) as fold changes in treated versus untreated samples, after β-actin normalization. All histograms show the mean values of three independent experiments. Bars indicate means ± SD. *P <0.05.

