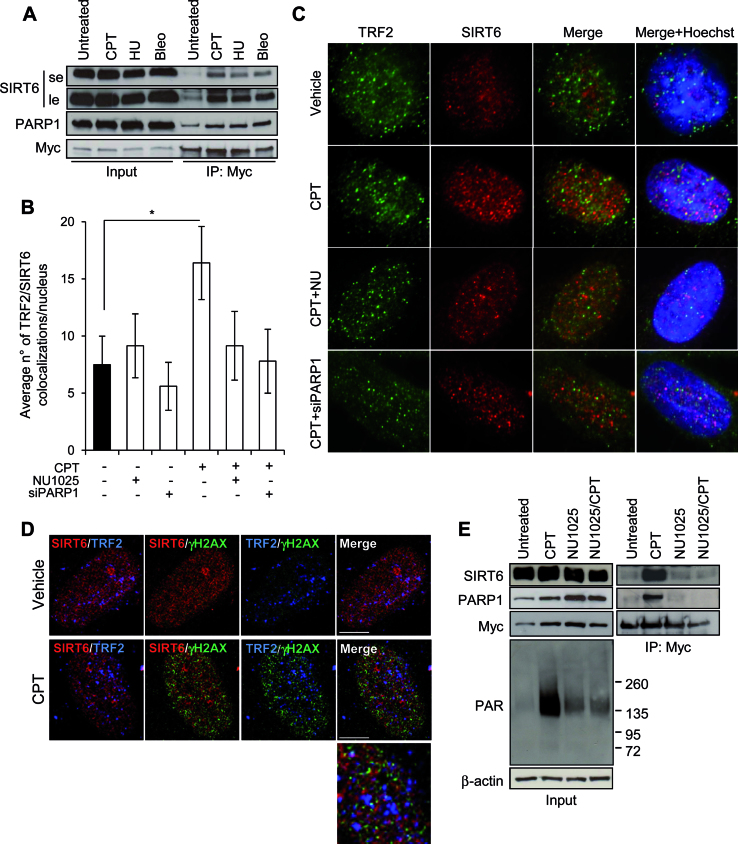
Figure 3.
TRF2 and SIRT6 interaction is increased by DNA damage in a PARP-dependent manner. (A) The IP was conducted on Myc-TRF2-overexpressing HCT116 cells untreated or exposed to the indicated drugs as reported in the Materials and Methods section. Input and immunoprecipitates were then analyzed by WB for the expression of the indicated proteins. le, long exposure; se, short exposure. (B and C) BJ-hTERT fibroblasts were treated with 2 μM CPT for 2 h alone or in combination with NU1025 or siPARP1, fixed and processed for co-IF against TRF2/SIRT6. Histograms report the average number of TRF2/SIRT6 colocalizations per nucleus, expressed as mean values of three independent experiments. Bars indicate means ± SD. *P < 0.05. (C) Representative images of colocalizations are shown (Leica deconvolution microscope 100× magnification). (D) Representative confocal IF images of an untreated or 2 μM CPT exposed sample of BJ-hTERT fibroblast. The single staining for TRF2, SIRT6 and γH2AX are reported in Supplementary Figure S4B. Here the double and triple (merge) staining are showed. In the enlarged panel the triple colocalizations appear as white spots. Scale bar 10 μm. (E) The IP was conducted on Myc-TRF2-overexpressing HCT116 cells untreated or exposed to 2 μM CPT for 2 h, alone or in combination with the PARP1 inhibitor, NU1025. Input and IP were then analyzed by WB for the expression of the indicated proteins.

