Figure 4.
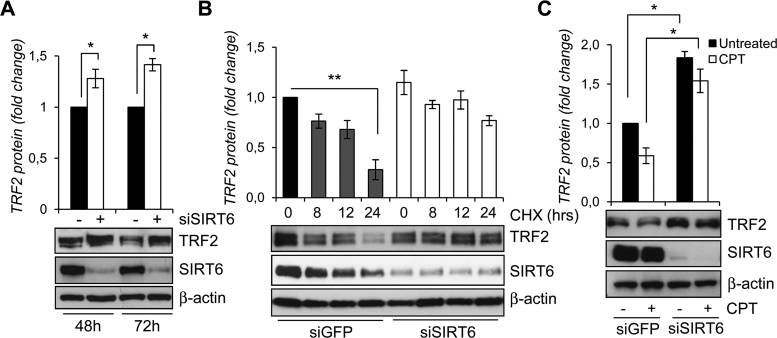
SIRT6 affects TRF2 stability. (A) WB analysis of TRF2 and SIRT6 levels in siGFP- or siSIRT6-transfected HCT116 cells after 48 and 72 h of siRNA delivery (lower panel). TRF2 expression levels were expressed in the histograms (upper panel) as fold changes in siSIRT6 versus siGFP samples, after β-actin normalization. (B) WB analysis of TRF2 and SIRT6 levels in siGFP- or siSIRT6-transfected HCT116 cells treated with 100 μg/ml cycloheximide for the indicated times (lower panel). TRF2 expression levels were expressed in the histograms (upper panel) as fold changes in treated versus untreated samples, after β-actin normalization. (C) WB analysis of TRF2 and SIRT6 levels in siGFP- or siSIRT6-transfected HCT116 cells after 6 h by the end of 2 μM CPT exposure (lower panel). TRF2 expression levels were expressed in the histograms (upper panel) as fold changes in treated versus untreated samples, after β-actin normalization. All histograms show the mean values of three independent experiments. Bars indicate means ± SD. *P < 0.05; **P < 0.01.

