Figure 2.
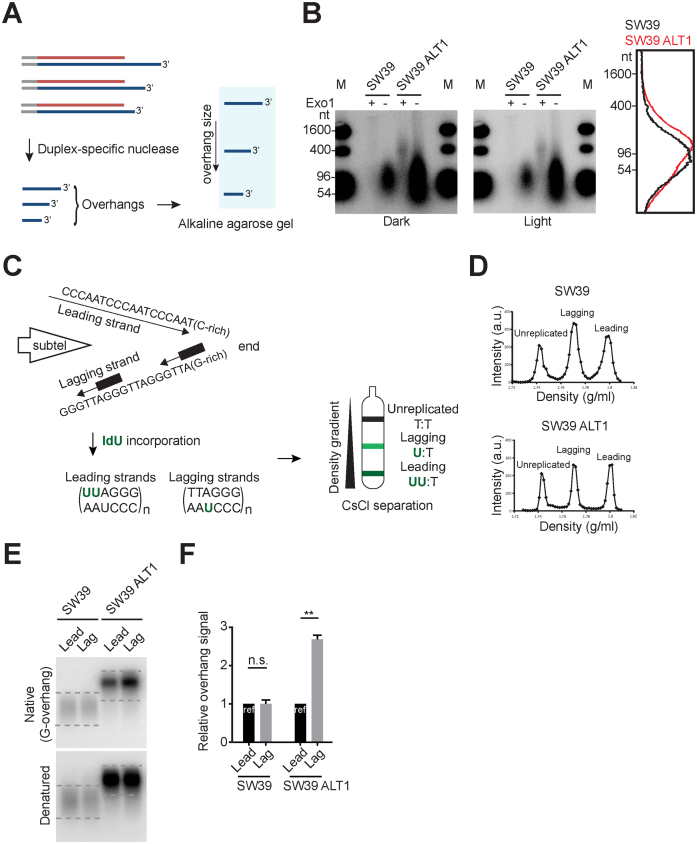
Excessively elongated lagging overhangs in ALT cells. (A) Illustration demonstrating Duplex-specific nuclease (DSN) overhang assay. DSN enzyme digests double stranded DNA and leaves the single stranded TTAGGG sequences present in the telomeric G-overhangs (3΄-overhangs). (B) DSN overhang assay in SW39 and SW39 ALT1 cells. Digested DNA (15 μg each) was run on 1.2% alkaline agarose gels. C-rich sequence probes were used for detecting G-overhangs. Right: Lines traces of SW39 (black) and SW39 ALT1 (red) gel lanes. (C) Illustration demonstrating CsCl separation of telomeric leading and lagging strands. Cells were usually incubated with IdU (5-Iodo-2΄-deoxyuridine) for 20 h (asynchronous condition) and then leading and lagging strands were separated using CsCl centrifugation. (D) CsCl separation of leading versus lagging strands in SW39 and SW39 ALT1 cells. a.u. represents arbitrary unit. (E) In-gel hybridization of telomeres in SW39 and SW39 ALT1 cells after leading/lagging strand separation. Native gels were hybridized with a C-rich probe to detect the amount of G-overhangs. Denatured gels were hybridized with a G-rich probe to measure the amount of total telomeric DNAs. Dashed lines indicate the quantified area. (F) Quantification of G-overhang intensity in E. Relative ratio of native signal to denatured signal was calculated (mean ± SEM; n = 2) ** indicates P < 0.01 and n.s. indicates non-significant (unpaired Student's t test).

