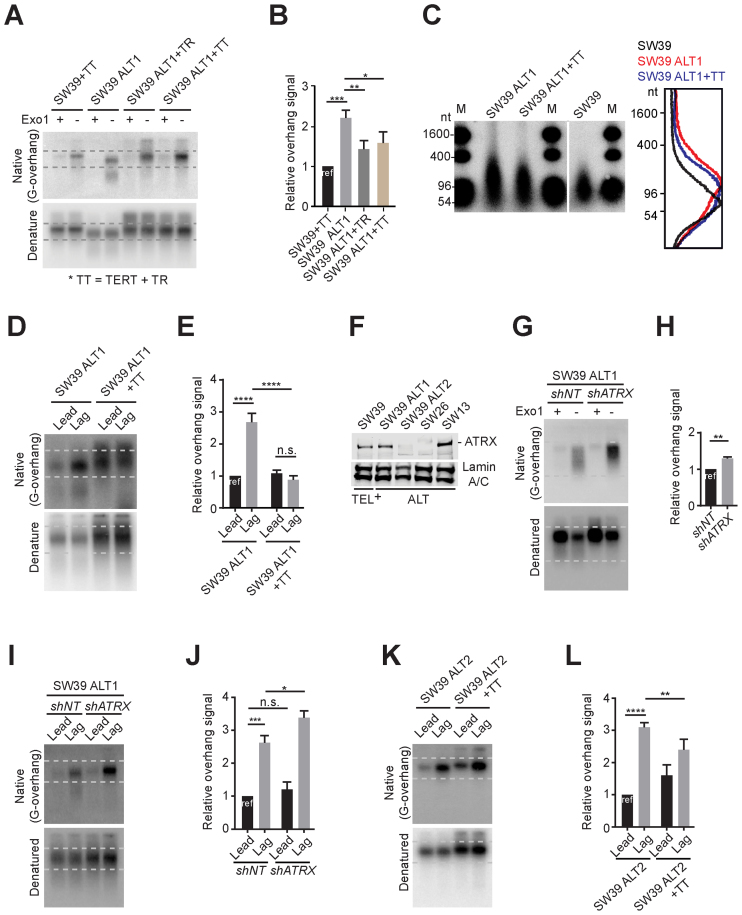
Figure 3.
Differential effects of telomerase reactivation on ATRX expression. (A) In-gel hybridization of telomeres in SW39 and SW39 ALT1 cells after introducing TERC or TERT gene expressing retrovirus. Cells were analyzed at 30 days post-infection. (B) Quantification of G-overhang intensity in A. Relative ratio of native signal to denatured signal was calculated (mean ± SD; n = 3). (C) DSN overhang assay in SW39 ALT1, SW39 ALT1 expressing TERC and TERT, and SW39 cells. Digested DNA (10 μg each) was run on 1% alkaline agarose gels (M: marker). Right: Lines traces of SW39 (black), SW39 ALT1 (red) and SW39 ALT1 + TT (blue). (D) In-gel hybridization of leading and lagging strand telomeres in SW39 ALT1 and SW39 ALT1 expressing TERC and TERT cells. (E) Quantification of G-overhang intensity in D. Relative ratio of native signal to denatured signal was calculated (mean ± SD; n = 3). (F) Western-blot for ATRX level from SW39, SW39 ALT1, SW39 ALT2, SW26 and SW13 cell lines. SW39 are telomerase positive and SW39 ALT1, SW39 ALT2, SW26 and SW13 are ALT cells. Lamin A/C was used as a loading control. (G) In-gel hybridization of telomeres in SW39 ALT1 after ATRX shRNA infection. Cells were analyzed 30 days post-infection. (H) Quantification of G-overhang intensity in G. Relative ratio of native signal to denatured signal was calculated (mean ± SD; n = 3). (I) In-gel hybridization of leading and lagging strand telomeres in SW39 ALT1 cells after ATRX shRNA infection. Cells were analyzed 60 days post-infection. (J) Quantification of G-overhang intensity in I. Relative ratio of native signal to denatured signal in leading or lagging strands was calculated (mean ± SD; n = 3). (K) In-gel hybridization of leading and lagging strand telomeres in SW39 ALT2 and SW39 ALT2 expressing TERC and TERT cells. Cells were analyzed 30 days post-infection. (L) Quantification of G-overhang intensity in K. Relative ratio of native signal to denatured signal was calculated (mean ± SD; n = 4). * indicates P < 0.05, ** indicates P < 0.01, *** indicates P < 0.001, **** indicates P < 0.0001 and n.s. indicates non-significant (unpaired Student's t test).

